
- Traveltime curves how they are created
- Fact-Sheets
- Software-Web-Apps

Travel-time Curves: How they are created
- Closed Captions (.srt)
- Text from the animation
- GIF Travel time short (Excerpt from animation) Your browser does not support the video tag.
- GIF Travel time Curve (Excerpt from animation) Your browser does not support the video tag.
Where do travel-time graphs come from?
A travel time curve is a graph of the time that it takes for seismic waves to travel from the epicenter of an earthquake to seismograph stations at varying distances away. The velocity of seismic waves through different materials yield information about Earth's deep interior. IRIS' travel times graphic for the 1994 Northridge, CA earthquake (described in No.5. Exploring the Earth Using Seismology) is animated to show how travel times are determined. Seismic waves "bounce" the buildings to merely illustrate arrival times and wave behavior, not to depict reality. The resultant seismograms show that stations around the world record somewhat predictable arrival times.
CLOSED CAPTIONING: A .srt file is included with the download. Use an appropriate media player to utilize captioning.
- Time vs. distance graph of P and S seismic waves
- Seismic waves recorded at different points are a function of distance from the earthquake
- Seismic velocities within the earth have been calculated from these data
Related Animations
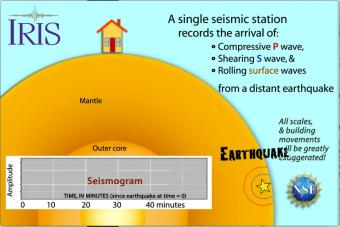
Seismic waves travel through the earth to a single seismic station. Scale and movement of the seismic station are greatly exaggerated to depict the relative motion recorded by the seismogram as P, S, and surface waves arrive.
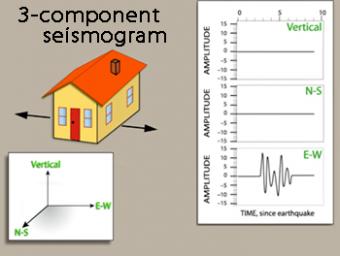
We use exaggerated motion of a building (seismic station) to show how the ground moves during an earthquake, and why it is important to measure seismic waves using 3 components: vertical, N-S, and E-W. Before showing an actual distant earthquake, we break down the three axes of movement to clarify the 3 seismograms.
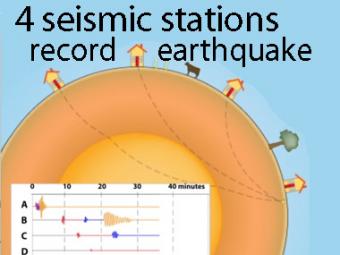
A cow and a tree in this narrated cartoon for fun and to emphasize that seismic waves traveling away from an earthquake occur everywhere, not just at seismic stations A, B, C, and D. A person would feel a large earthquake only at station A near the epicenter. Stations B, C, D, and the cow are too far from the earthquake to feel the seismic waves though sensitive equipment records their arrival.
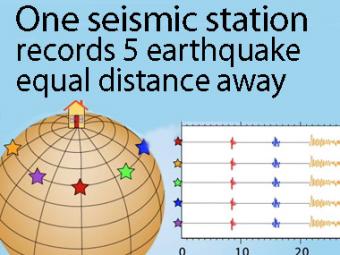
A gridded sphere is used to show a single station recording five equidistant earthquakes.
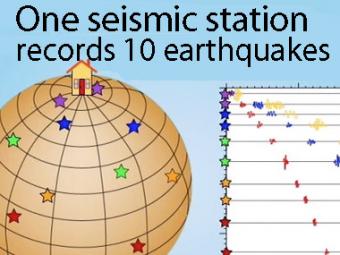
A gridded sphere is used to show: 1) the seismic stations don't need to be lined up longitudinally to create travel-time curves, as they appear in the first animation, and 2) a single station records widely separated earthquakes that plot on the travel-time curves.
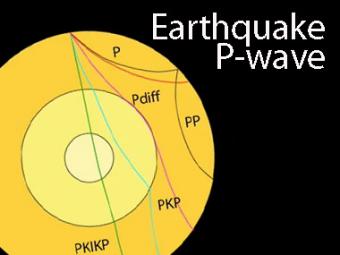
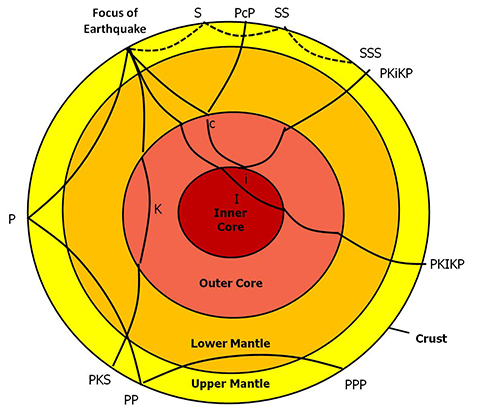
The shadow zone is the area of the earth from angular distances of 104 to 140 degrees from a given earthquake that does not receive any direct P waves. The different phases show how the initial P wave changes when encountering boundaries in the Earth.
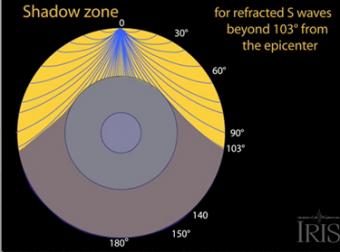
The shadow zone results from S waves being stopped entirely by the liquid core. Three different S-wave phases show how the initial S wave is stopped (damped), or how it changes when encountering boundaries in the Earth.
Related Fact-Sheets
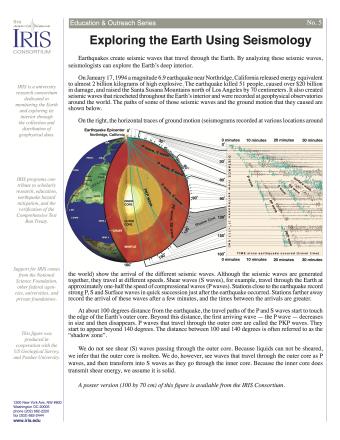
Earthquakes create seismic waves that travel through the Earth. By analyzing these seismic waves, seismologists can explore the Earth's deep interior. This fact sheet uses data from the 1994 magnitude 6.9 earthquake near Northridge, California to illustrate both this process and Earth's interior structure.
NOTE: Out of Stock; self-printing only.
Related Software-Web-Apps
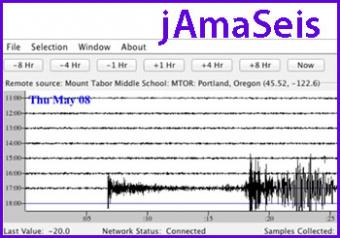
jAmaSeis is a free, java-based program that allows users to obtain and display seismic data in real-time from either a local instrument or from remote stations.
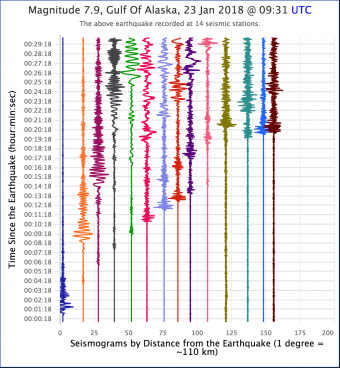
Seismic Waves is a browser-based tool to visualize the propagation of seismic waves from historic earthquakes through Earth’s interior and around its surface. Easy-to-use controls speed-up, slow-down, or reverse the wave propagation. By carefully examining these seismic wave fronts and their propagation, the Seismic Waves tool illustrates how earthquakes can provide evidence that allows us to infer Earth’s interior structure.
Related Videos
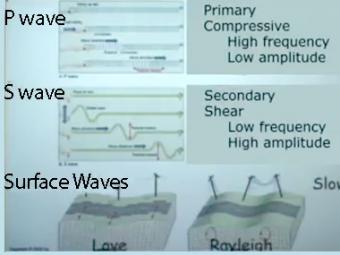
Video lecture on wave propagation and speeds of three fundamental kinds of seismic waves.
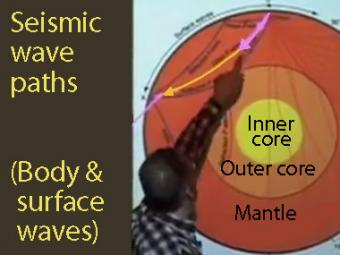
A video demonstration of how a slinky can be a good model for illustrating P & S seismic waves movement.
Related Lessons
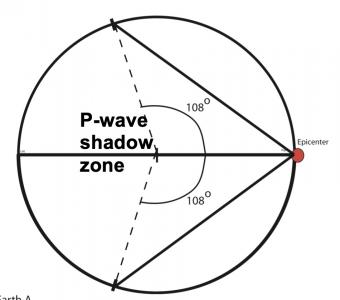
Learning occurs as students work first in small groups and then as a whole class to compare predicted seismic wave travel times, generated by students from a scaled Earth model, to observed seismic data from a recent earthquakes. This activity uses models, real data and emphasizes the process of science.

To understand plate tectonic processes and hazards, and to better understand where future earthquakes are likely to occur, it is important to locate earthquakes as they occur. In this activity students use three-component seismic data from recent earthquakes to locate a global earthquake.
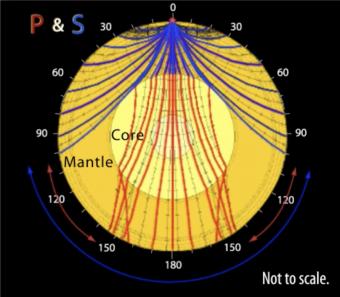
In this multi-step lab, students explore the concepts of seismic wave propagation through materials with different mechanical properties, and examine seismic evidence from a recent earthquake to infer Earth’s internal structure and composition. This lab is designed to be done with an instructor present to answer questions and guide students to conclusions
Related Posters
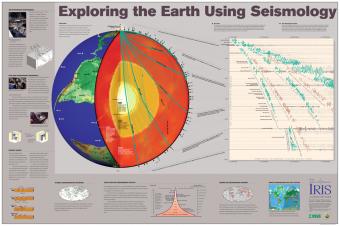
Seismic waves from earthquakes ricochet throughout Earth's interior and are recorded at geophysical observatories around the world. The paths of some of those seismic waves and the ground motion that they caused are used by seismologists to illuminate Earth's deep interior.
- Mailing Lists
- Early Career Investigators
- Career Opportunities
- Frequently Asked Questions
- Privacy Policy
- Comments about this page
- Instrumentation Services
- Data Services
- Education and Public Outreach

Seismic Waves
Introduction Seismology is the study of the passage of elastic waves (see below) through the earth. Earthquake seismology is the best tool to study the interior of the earth.
When an earthquake or explosion occurs, part of the energy released is as elastic waves that are transmitted through the earth.
The waves are then detected and recorded by seismograms , which measure, amplify and record the motion of the ground.
The information is then used to determine earthquake locations, the subsurface structures and etc.
This pendulum-mounted seismograph records horizontal motion. The mass is coupled to the Earth by means of a pendulum and a pivot is attached to a rod to constrain the mass to move in the horizontal direction only.
The spring-mounted seismograph records the vertical ground motion. A spring is attached to the mass which is connected to a rod. The rod is attached to a pivot to constrain the mass to move in an up and down direction only.
Basic Physics There is some basic terminology and physics that describe the various aspects of wave form and motion.
The wavelength (λ) is the distance between two adjacent points on the wave that have similar displacements, one wavelength is the distance between successive crest.
Amplitude (A) of the wave is the maximum displacement of the particle motions, or the height of the ripple crest.
Period (T) is the time it takes for two successive waves to pass a reference point or the motion to complete one cycle.
The cycle of seismic waves or repetitions in a given unit of time is called frequency (f). Frequency and period are related by this relationship:
f = 1 / T [unit: hertz (Hz) or 1/s]
The speed in which the wavefront (or ripple crest) travel can be detected if the time the wavefront takes to reach a known distance is recorded:
V = distance / time [unit: m/s]
Or if wavelength and frequency are known:
V= f λ
Elastic Moduli Elasticity is the behavior of a material that when subjected to a stress (force/area), deforms and changes shape ( strain ), but returns to original shape when the stress is removed.
The manner and speed of seismic waves travel through material is controlled by their elastic properties.
The linear relationship between applied stress, σ, and resulting strain ε is:
σ = Eε
E is the constant of proportionality called an elastic modulus .
We are concerned with two types of deformation – uniform compression or expansion, and shear deformation:
The original volume (V 0 ) change to final volume (V F ) when compared to the pressure change is called bulk modulus (K). The bulk modulus is a measure of the incompressibility of the material:
K = V 0 (P-P 0 )/(V 0 -V F )
When deforming a solid state by simple shear, a shear strain (γ) is induced by applying a shear stress, σ. The ratio of these quantities is the rigidity modulus (G):
G = σ/ γ
Units of elastic modulus are the same as pressure – i.e. MPa or GPa.
There are two different types wave produced by an earthquake : body waves and surface waves. Body Waves
· Body waves are seismic waves that travel through the body of the earth.
· Body waves are reflected and transmitted at interfaces where seismic velocity and/or density change, and they obey Snell's law .
The two different types of body waves are:
· P-Waves (P stands for primary or pressure or push-pull). These waves are also called longitudinal waves or compressional waves due to particle compression during their transport. These waves involve compression and rarefaction of the material as the wave passes through is but not rotation. P-wave is transmitted by particle movement back and forth along the direction of propagation of the wave. The most correct description of P-waves is it is a dilational or irrotational waves.
· P-waves has the greatest speed and appears first on seismograms.
· S-Waves (S stands for secondary or shear or shake). Also known as transverse waves , because particle motions are transverse to the direction of movement of the wavefront, or perpendicular to the ray. These waves involve shearing and rotation of the material as the wave passes through it, but not volume change.
· S-waves have speeds less than P-waves, and appear on seismograms after P-waves.
Surface Waves
· Surface waves are seismic waves that are guided along the surface of the Earth and the layers near the surface.
· These waves do not penetrate the deep interior of the earth, and are normally generated by shallow earthquakes (nuclear explosions do not generate these surface waves).
· Surface waves are larger in amplitude and longer in duration than body waves.
· These waves arrive at seismograph after the arrival of P- and S-waves because of their slower velocities. The two different surface waves are:
· Rayleigh waves or descriptively called "ground roll" in exploration seismology. The particle motion of this wave is confined to a vertical plane containing the direction of propagation and retrogrades elliptically. The particle displacements are greatest at the surface and decrease exponentially downward. Rayleigh waves show dispersion, and its velocity is not constant but varies with wavelength. This wave is similar to how ocean waves propagate.
· V R < V S
· Period is typically ~ 20 s, with wavelength or ~ 100km
· Love waves (named for A.E.H. Love, who discovered them) travel by a transverse motion of particles that is parallel to the ground surface. This wave is somewhat similar to S-waves.
· Love waves cannot exist in a uniform solid, and can only occur when there is a general increase of S- wave velocity with depth.
· Their existence is another proof of the Earth’s vertical inhomogeneity.
· The particle motion is transverse and horizontal.
· Generally, Love wave velocities are greater than Rayleigh waves, so Love waves arrive before Rayleigh waves on seismograph.
Seismic Wave Velocities
· The velocities of P- and S-waves are given below in terms of the density (ρ) and elastic coefficients of a material:
Vp = √((K+4/3G)/ρ)
Vs =√(G/ρ)
· If we note that the bulk modulus (K) and the rigidity modulus (G) are always positive, then evidently the velocity of P-waves must always be greater than S-waves.
· Shear waves (S-waves) cannot propagate through liquid. This is evident when we substitute G = 0 for liquids, then the velocity of S-waves goes to zero.
· This is how it was determined that the outer core consists of liquid.
· Some times you will come across the bulk sound velocity:
V Φ =√(K/ρ)
= √(Vp 2 -4/3Vs 2 )
· Also, Vp and Vs are related via Poisson’s ratio (r).
· When a rod is stretched it becomes longer but narrower, the ratio to the lateral to longitudinal strain is Poisson’s ratio.
· The ratio of Vp to Vs is given by:
Vp/Vs = [2(1-r)/(1-2r)] 1/2
· For most rocks, r ~ 0.25, so Vp ~ 1.7 Vs.
There are a few more general rules to the velocity ranges of common materials:
o Unsaturated sediments have lower values than saturated sediments.
o Unconsolidated sediments have lower values than consolidated sediments.
o Velocities are very similar in saturated, unconsolidated sediments.
o Weathered rocks have lower values than similar rocks that are unweathered.
o Fractured rocks have lower values than similar rocks that are unfractured.
Below is a list of velocity estimation of common waves:
For rocks can plot V v. density:
More generally, Birch observed a general relationship between density and seismic wave velocity which helps us establish the composition of the Earth:
Now see more detailed notes on seismic waves , and you might like also like to look at the associated practical (optional).
Seismic Ray Theory
· when seismic rays travel through the earth, they encounter changes in k, g and ρ. this causes the rays to be reflected and refracted ., · when seismic energy travels, it ideally would do so in an approximately spherical way:, · the energy at the wave front gets weaker as it moves from its source. this geometrical spreading of the energy causes the amplitude to drop. the energy drops off as x -2 , and the amplitude as x -1 – this is called attenuation ., layered media - normal incidence, · when a ray hits an interface with normal incidence (ie at right angles to the boundary), some energy is reflected, while the rest is passed through into the lower boundary., · the reflection coefficient (r) is the ratio of the ratio of the reflected ray amplitude to the incident ray amplitude:, r= a 1 /a 0, · for normal incidence this is given by:, r= (z 2 -z 1 )/(z 2 +z 1 ), where z is the acoustic impedance , and given by, z = ρv, · the transmission coefficient (t) is:, t = a 2 /a 0, = 2z 1 /z 2 +z 1, oblique incidence, · when a p-wave is obliquely incident, there is a reflected p wave, and the transmitted ray is refracted in accord with snell’s law., · in addition, some of the compressional energy is converted into shear energy, and a reflected and refracted s-wave is generated too., refraction & reflection seismology, reflection seismology is used mostly in exploration methods, while refraction seismology is use more in whole earth studies. here we will first focus on refraction seismology, what is seismic refraction, o one can study subsurface velocity and layer interface structure by analyzing the first arrival times of p-waves (longitudinal or compressional waves) at the surface of the earth. this technique is termed seismic refraction..
o Applications of subsurface imaging include:
1. locating buried archeological sites,
2. assessing subsurface geological hazards,
3. defining aquifer geometry
4. exploring for fossil fuel and other natural resources.
Seismic P-Wave Behavior
· When a ray encounters an inhomogeneity in its travels, for example a lithological contact with another rock, the incident ray transforms into several new rays. A reflected wave enters and exits at the same angle measured to the normal of the boundary - angle of incidence equals angle of reflection.
o From Snell's Law, a ray path is dependent on the wave velocities through different layers.
o For refraction seismology, the critical angle is the most important angle value to understand. If angle (r) equals 90 degrees, then the refracted wave propagates along the boundary interface.
o If r = 90, then sin(r) = 1, and the critical angle (i c ) is given by:
i c = sin -1 (V 1 /V 2 )
o As the critically refracted wave propagates along the boundary, according to Huygen's Theory of Wavelets, the primary critically refracted wave acts as a source for new secondary wave fronts and ray paths.
o These secondary ray paths exit back to the surface at the critical angle.
Simple Refraction Model
o Two Horizontal Layers - In the ideal world (of engineering), refraction seismology is most easily understood through a horizontal two layer model.
Seismic waves are generated from a source (e.g. a sledge hammer, explosion, air gun….).
o Geophone receivers record seismic signals received along the survey profile.
o Since P-waves travel at the fastest speeds, the first seismic signal received by a geophone represents the P-wave arrival.
o Five P-waves are of interest in refraction seismology:
o direct
o diving
o reflected
o head
o refracted
o The direct wave propagates along the atmosphere-upper layer (called layer1) boundary.
o A transmitted wave through lower layer (layer 2) is termed a diving wave .
o A reflected wave enters with the same angle of incidence as exit angle.
o If the incident wave hits at the critical angle, the critically refracted head wave travels along the layer 1-layer 2 interface.
o Refracted waves propagate from the interface as the head wave progresses, with exit angles equal to the critical angle.
o With arrival time data collected, arrival times for P-waves are noted or computed from the seismographs.
o Arrival times can be represented on a travel-time graph or T-X plot, that is P-wave arrival times (usually in milliseconds) verses distance (geophone location).
o This plot shows that at small distances ( x ) from the source, the direct wave arrives first.
o At distances up to the critical distance only the direct ray, and weakly (sub-critically) reflected rays arrive at the geophone. The reflected rays are always later than the direct ray.
o At the critical distance , direct waves and the first refracted ray arrives. Its amplitude is stronger than the reflected ray, but is still later than the direct ray.
o At some distance (the cross over distance ), the refracted ray arrives first, since it has traveled at V 2 for long enough in the interface so as to catch up the direct ray.
o From the travel-time curve we can calculate:
o velocities of P-wave propagation through layers 1 and 2 (V 1 and V 2 )
o thickness of layer 1 (H 1 ).
o To obtain these values, combination of equations and interpretation from the T-X plot is required.
o The travel time of the direct wave is given by:
t DIRECT = x/V 1
o So V1 can be obtained from the slope of the direct arrivals, which passes through the origin.
o The travel time for a reflected ray is given by:
t REFLECTION = (x 2 + 4H 1 2 ) 1/2 /V 1
o This is the equation for a hyperbola, where H 1 is the layer thickness.
o The travel time for the refracted wave is given by:
t REFACTED = x/V 2 + 2H 1 (V 2 2 –V 1 2 ) 1/2 /(V 1 V 2 )
o See detailed notes and Fowler for full derivations.
o The equation for t REFRACTED is that of a straight line ( y = mx + c). The slope gives 1/V 2 and the intercept on the t axis (i.e. when x=0) enables H 1 to be determined from:
H 1 = t (x=0) (V 1 V 2 )/2(V 2 2 –V 1 2 ) 1/2
Two Layer Dipping Model
o When discussing dipping layers, one wants to quantify the amount of dip. For a simple case of two dipping layers, seismic refraction can be utilized to calculated dip of the layers.
o For a given survey profile, sources must be located at the beginning of the profile (forward shot) and at the end of the profile (reverse shot).
o P-wave arrival times for both forward and reverse shots can be plotted on a T-X plot.
o From the Principle of Reciprocity, time required for a ray to travel along the forward and reverse shot should be the same, since the ray pathways are the same.
o From the T-X plot, V1 and V2 velocities for forward and reverse shots can be calculated, as well as the time-intercepts for forward and reverse refracted waves.
Kearey & Brooks (1984) show how this geometry can be analyzed to get h, θ, etc.
Horizontal Multi-Layer Model
o Calculation of layer velocities and thicknesses for multi-layers requires patience with many equations chock full of algebra and trigonometry.
o Please refer to Kearey & Brooks(1984), Fowler (1990) for these equations. Interpretation of T-X plots remains the same.
o Each layer yields an interpolated refracted wave slowness, and time intercept used to calculate layer thickness.
o This approach leads to understanding why seismic rays are reflected back to the surface on Earth as V increases generally with depth:
Problems and Limitations
o The preceding models assume planar boundary interfaces . Conformable sequences of sedimentary rock may form planar boundaries. However, erosion and uplift easily produce irregular boundary contacts. More sophisticated algorithms can process refraction surveys where irregular interfaces might be expected.
o Profile length and source energy limit the depth penetration of the refraction method. Typically, a profile can only detect features at a depth of one-fifth survey length.
Thus, refraction imaging of the Moho would require profile lengths of over one hundred kilometers; an difficult experiment.
o Larger sources could be utilized for greater depth detection, but certain sources (e.g. explosives) may cause problems in urban areas.
o Refraction depends on layers to increase in velocity with depth. In the hidden slow layer senario, a buried layer is overlain by a faster layer. No critical refraction will occur along the boundary interface.
Thus, refraction will not easily detect the slow layer . All is not lost since reflection seismology could detect the slower layer.
o Seismograms require careful analysis to pick first arrival times for layers. If a thin layer produces first arrivals which cannot easily be identified on a seismogram, the layer may never be identified. Thus, another layer may be misinterpreted as incorporating the hidden layer. As a result, layer thicknesses may increase.
Reflection Seismology
Reflection seismology began to take prominence in the 1920s to begin to locate salt domes, an indication where oil would be found.
The reflection method soon replaced the refraction after it was proved with numerous successes, the most visible in the petroleum industry.
Lets Start With a Single Subsurface Interface
The key is to develop an equation which represents the time it takes for a particular ray to travel through this single layer. First, the seismic velocity through the layer of material that the wave is propagating needs to be lower than the layer directly below, which we will assume is infinitely thick.
Therefore, just by simple time-velocity relation and geometry:
This can be re-written (dropping the subscripts) as:
V 2 t 2 = x 2 +4h 2
V 2 t 2 /4h 2 – x 2 /4h 2 = 1
which has a hyperbolic form:
Now, What Does That Arrival Time Mean Anyway?
Well, the first thing to note is what you can do with the hyperbola.
A hyperbola has an asymptote along which the hyperbola approaches. The equation of this line is
Therefore, the asymptote for the travel time curve has a slope of the reciprocal of the velocity.
Another approach to analysing the data is to get v elocity and thickness from a plot of x 2 v t 2 . Now recall:
By squaring both sides, the equation resembles closely the equation of a straight line.
The slope of the line is the reciprocial of the square of the velocity. The intercepts gives h via:
Exploration Seismology
In the exploration industry there are many ways of processing reflection data so as to provide more information about the near sub-surface. This is beyond this course, but you may read more non-examinable material , and also in the following text taken from the Signalworks Pty. Ltd web site.
An Introduction to Reflection Seismology Data Processing (from Signalworks Pty. Ltd) Introduction R eflection seismology is a technique for imaging the geological structure beneath the earth's surface using sound energy. The technique is used primarily for oil exploration. An acoustic energy source at the surface transmits an acoustic signal into the earth, which reflects some of the energy back toward the surface at each geological interface. An array of geophones or hydrophones detects the faint signals reflected back to the surface, which are recorded for later processing. The raw data is very noisy and uninterpretable, requiring extensive processing to produce an image of the earth's interior. Figure 1. Marine Seismic Data Acquisition. Seismic Data Acquisition. F igure 1 illustrates the process of marine seismic data acquisition. The survey ship trails an acoustic source (usually compressed air 'guns') and a string of hydrophones, called a streamer. The streamer is usually about 4000m in length and contains groups of hydrophones spaced typically every 15m. When the air guns are fired, releasing a pulse of compressed air, a pressure pulse radiates in an approximately spherical wavefront through the water and into the earth. The semi-circles in figure 1 indicate the position the wavefront at regular intervals in time (say every 100mS). When the wavefront reaches a reflecting geological boundary, some of the wavefront energy is reflected back towards the surface (light grey semi-circles). This echoed acoustic energy is sensed by the hydrophones and recorded on the ship for later processing. To simplify seismic acquisition models, the energy received at a hydrophone can be considered to have travelled along a linear raypath from the source, into the earth, then reflecting from the boundary back to the hydrophone. Raypaths from the source to four hydrophones are shown in figure 1. The raypaths are perpendicular to the wavefronts. Principles of Acoustic Imaging. A coustic imaging in its simplest form consists of measuring the time taken by a pulse to travel from a source to a reflector and back to a receiver. Repeating these measurements over a range of positions allows an image of the reflecting surface to be formed. Figure 2 shows the configuration of a simple imaging system. In practice, noise and imaging distortions require more elaborate data acquisition configurations and data processing techniques to achieve accurate imaging. Figure 2. Simple Acquisition Configuration. Ideally, the simple acquisition configuration could be used to produce the acoustic image shown in figure 3. Each geological interface reflects some of the acoustic signal so that each trace shows a pulse corresponding to each reflector, with an increasing reflector depth resulting in an increasing time delay on the corresponding pulse. a) ..........b) Figure 3. a) Simple Acquisition Acoustic Image and .. b) Detail of First Trace (Ideal case). Imaging Problems and Solutions. T he simple imaging technique shown in figure 2 was used in the early days of seismic imaging, but produced poor results. The main problems were: a) Noise -- the reflection energy is usually small after travelling a large distance and bouncing off a weak reflector. Spurious noise in the earth, air and recording electronics can swamp the reflection signal. b) Multiples -- the raypaths not only travelled from source to receiver with one bounce off a reflector, but also followed paths making several intermediate bounces between reflectors and producing a travel time out of proportion to the reflector depth. Events on the image associated with raypaths making multiple bounces are called 'multiples' and should be removed from the image. c) Source Pulse Shape -- the source pulse may not be sharp enough to produce a high resolution image and may vary in shape from shot to shot. (The activation of the source to produce a pulse is termed a 'shot'.) d) Positioning of Dipping Reflectors -- the acoustic image is produced by displaying the trace at each record location vertically on the image. If a reflector is dipping, the raypath reflection point does not lie vertically below the record location, but is offset to one side. Further processing is required to correctly position the acoustic image. a) ..........b) Figure 4. a) Noisy Image and .. b) Detail of First Trace. Figure 4 shows the effect of noise on the image. The reflected acoustic pulses are recorded from the hydrophones with a peak amplitude of 1mV. The noisy image shown in the figure has had random noise added with a normal amplitude distribution, mean value of 0mV and standard deviation of 0.5mV. The noise has nearly completely masked the reflection energy. The reflections cannot be discerned on the extracted trace shown in figure 4 (b). Adding together repeated records taken at the same location can be used to improve the signal to noise ratio. Figure 5 shows a series of 32 repeated records. The reflected energy at 156mS and 416mS can be vaguely made out on this display, but would be difficult from a single trace. This figure also shows the result of 'stacking' these records. Stacking involves summing each trace and normalising the resultant summed trace. The reflection energy is reinforced and the random noise tends to cancel in the stacked trace (figure 5 (b)), resulting in an increased signal to noise ratio (S/N). a) ..........b) Figure 5. a) Repeated Seismic Records and .. b) Resultant Stacked Trace. a) ..........b) Figure 6 a) Raypath of 'Multiple' Energy and .. b) Recorded Trace with Multiple at 312mS. F igure 6 (a) shows the raypath of acoustic energy making two bounces off reflector 1 between the source and receiver. The recorded pulse of this energy is termed a 'multiple' and can be seen at 312mS on the recorded trace of figure 6 (b). To obtain an acoustic image resembling the reflecting layers, multiples must be removed as they are mis-positioned on the image. The pulses of energy that travel directly from source to receiver with a single bounce off the reflectors are termed 'primaries' and produce proportional images of the geology. a) ..........b) Figure 7. a) Common Depth Point Acquisition Configuration and .. b) CDP Gather. F igure 7 (a) shows the data aquisition configuration that allows multiple energy to be identified and removed during processing. This is called the Common Depth Point (CDP) method because the data is repeatedly recorded over increasing source to receiver offsets, but with the raypaths reflecting off the same depth location on each geological surface. The CDP gather shown in figure 7 (b) shows the recorded traces for all source / receiver pairs. As the source to receiver offset increases, the length of the raypath bouncing off a reflector increases and the pulse is recorded at a larger time delay. The curved line of pulses on the gather corresponding to a particular reflector is called an 'event', and its shape is determined by the reflector's depth and the acoustic velocity along the raypaths. It is the shape of the event that allows multiple events to be identified and removed by 2D filtering. The ideal shape of these events is hyperbolic and is called a Normal Move Out (NMO) curve. When the geological layers are flat and have constant acoustic velocity, the events have an accurate NMO shape. As the geology becomes more complex with sloping layers and rapid velocity variations, the events deviate from the ideal shape. a) ..........b) Figure 8. a) NMO Corrected CDP Gather and .. b) Trace Produced by Stacking the Gather. T he process used to filter out the multiples is called 'stacking'. This is a two stage process involving distorting the gather so that the primary events become flat (termed 'NMO correction'), then summing each trace to produce a single stacked trace. The stacked trace is also usually rescaled by a factor of 1/N, where N is the number of traces added in the stack. The shallow primary reflector has been flattened in the gather, but the NMO correction has stretched out the pulse in the long offset traces. This is called 'NMO stretch' and will reduce the sharpness of the corresponding stacked pulse. This is seen in the 156mS event in figure 8 (b) when compared to the ideal event shape in figure 6 (b). To reduce the problem, regions of excessive NMO stretch are zeroed ('muted') before stacking. The multiple event at about 312mS is not flattened by the primary NMO correction and has reduced amplitude on the stack trace. Figure 8 (b) shows that the multiple amplitude has been reduced by about 50% while the primary amplitudes have been preserved. This performance can be improved by increasing the range of offsets recorded in the gather and increasing the sharpness (or resolution) of the pulses. a) ..........b) Figure 9. a) CDP Gather (Sharp Acoustic Pulse) and .. b) Stacked Trace. Figure 9 shows the NMO corrected CDP gather and stacked trace produced using a sharper acoustic pulse. The sharp pulse has a dominant period of 25mS compared to 51mS used previously. The multiple on the stacked trace is reduced to around a quarter of the amplitude of the primary events. a) ..........b) Figure 10. a) Raw Seismic Wavelet and .. b) Wavelet after Shaping. Seismic sources usually produce non-ideal wavelet (or pulse) shapes, often having several oscillations over a broad wavelet and inconsistent shapes from shot to shot. A raw wavelet such as shown in figure 10 (a) can be filtered to remove oscillations and sharpen the pulse to produce a shaped wavelet shown in figure 10 (b). An ideal sharp wavelet improves the resolution and interpretability of the acoustic image. Figure 11. The Reflection Point for a Dipping Reflector is Offset from the Middle of the Source / Receiver Pair. Figure 11 shows the raypath from a near offset source / receiver pair down to a dipping reflector. The reflection point does not lie beneath the centre of the source / receiver where it is plotted on a stacked trace section. The process of repositioning dipping reflectors is called 'migration', and the output of this process is a 'migrated section'. Migration also corrects 'diffractions', which are hyperbola shaped events appearing on stack sections and emanating from sharp discontinuities in the geology. Migration can be performed on a stack section by summing amplitudes along a hyperbolic curve and placing the scaled sum at the apex of the hyperbola. This can also be viewed as collapsing diffractions to a point over the entire stack section. The shape of the summing hyperbolas varies over the section and is a function of the depth and shallower acoustic velocities. The velocity distribution determined from earlier stacking velocity analyses can be used to control the migration process. a) ..........b) Figure 12. a) Stacked and .. b) Migrated Seismic Sections. Figure 12 (a) shows a stacked section with a steeply dipping reflector mis-positioned. The migrated section (figure 12 (b)) shows the dipping reflector re-positioned in the up-dip direction and with a steeper slope.
- Docs »
- Seismic »
- Basic principles »
- Travel times
- Edit on GitHub
Travel times 
A seismic wave travelling through an isotropic homogeneous medium will propagate at a constant velocity. Therefore, the time \(t\) required for a seismic wave to travel from source to receiver in a homogeneous earth layer with velocity \(v\) is simply given by the formula
where \(d\) is the distance travelled in the layer. In a seismic survey we measure source to receiver travel times and use those data to estimate the properties of the subsurface. Basic seismic interpretation methods assume that the earth is composed of a series of uniform layers and attempt to compute the thicknesses, velocities, and sometimes dips of each layer. We will discuss specific techniques for computing layer thicknesses and velocities in the reflection and refraction survey sections. However, we will introduce the concept of travel time computations and how they relate to geometry here, using the example of a two layered earth.
Consider a layer of thickness h and velocity \(v_1\) overlying a uniform halfspace of velocity \(v_2\) . A source is detonated at time \(t=0\) . We are interested in the waves and arrival times of those waves at a receiver which is located at a distance \(x\) from the source at position \(D\) in the figure below. There are three principal waves that will travel through the earth and arrive at position D. i) direct waves, ii) reflected waves, and iii) critically refracted waves.
The travel time curves for these ray paths are shown below, where the horizontal axis represents distance from the source along the flat surface of the earth, \(x_{crit}\) is called the critical distance, and \(x_{cross}\) the crossover distance. The critical distance is the closest surface point to the source at which the refracted ray can be observed. The crossover distance is the surface point at which the direct and refracted rays arrive at the same time. At offsets from the source greater than the crossover distance the refracted ray will be the first signal to arrive from the source. You can explore these concepts interactively using the Science seismic refraction app . Instructions for using the app can be found here . The following video illustrates the propagation of headwaves and how they relate to the crossover distance
Travel times of visible arrivals are related to the distance between source and receiver ( \(x\) ), thickness of the layer ( \(h\) ) and the wave velocities in the upper layer and basement ( \(v_1\) and \(v_2\) ). Let us denote the arrival times at point \(x\) for the direct, reflected and refracted waves as \(t_{dir}\) , \(t_{refl}\) \(t_{refr}\) respectively. These times are given by the following formulas
Note that the formulas for the direct and refracted waves are linear in \(x\) but that the reflected arrival time formula is not.
Before moving on, let’s look at an example of how travel times show up in the field. The horizontal axis of the following plot shows offset from a seismic receiver. Each line plots the displacement vs time curve of a geophone at a given offset. The plot clearly shows a set of events moving linearly in time from one geophone to the next.
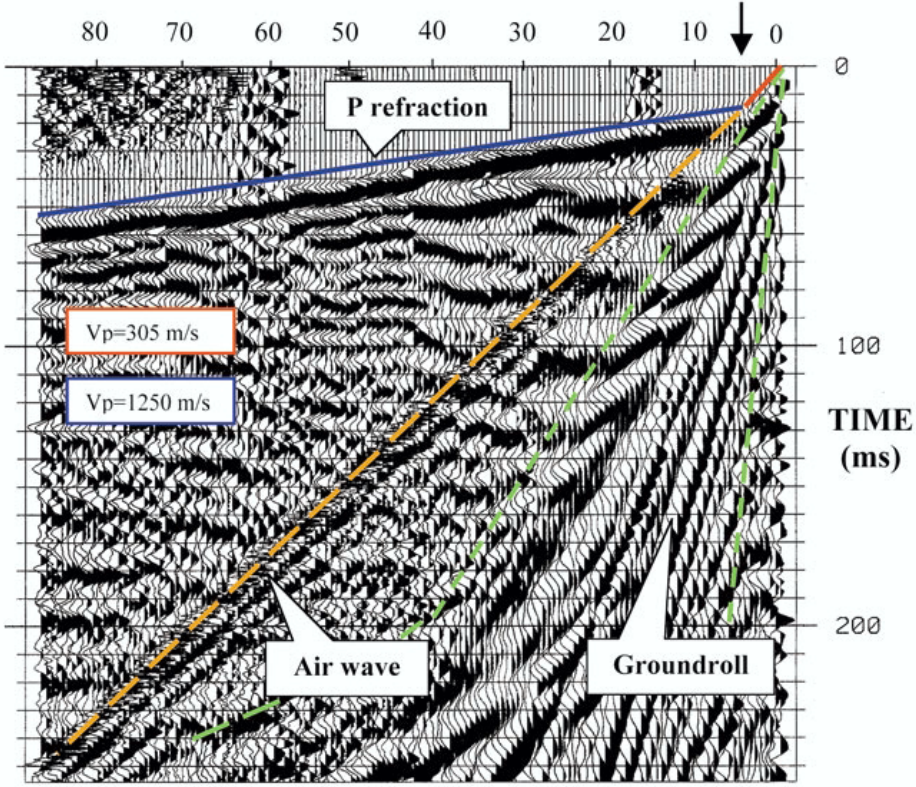
We will now discuss the computation of traveltimes in more detail. It is important to note here that computing traveltimes for an arbitrary, heterogeneous earth is a complex problem well beyond the scope of this course. However, much insight can be gained by assuming that the subsurface consists of a series of homogeneous layers with horizontal or possibly dipping interfaces.
Refracted ray in a two layered-earth 
We need to identify specific ray paths and their associated travel times. Consider an earth composed of a uniform layer with velocity \(v_1\) and thickness \(z\) overlying a medium with velocity \(v_2\) . Let \(\theta\) be the critical angle and x denoted the distance between the source at \(A\) and a receiver at \(D\) . Let \(x_c\) denote the critical distance.
From elementary geometry the following relationships hold:
The travel time is the cumulative time for the wave to traverse the path \(ABCD\) . This is \(t=t_{AB}+t_{BC}+t_{CD}\) .
Generally time = distance / velocity, so we can write \(t_{AB} = L/v_1 = (z/cos\theta) / v1\) , (using \(L\) from just above).
Also, we can note that \(t_{AB} = t_{CD}\) and the distance \(BC\) is \(x-x_c\) . So we can now state that \(t=2t_{AB}+t_{BC}\) , or
It is convenient to rearrange this slightly differently. Using the definition for critical angle \(\sin\theta=v_1/v_2\) , we can make the “velocity triangle”, so expressions for the angle arise directly from simple trigonometry:
Use these two relations for \(\cos\) and \(\tan\) in the expression for t above to obtain a useful set of relations.
This simple relation says that the travel time curve is a straight line which has a slope of \(1/v_2\) and an intercept of \(t_i\) . This intercept time is the time where the refraction line extends to intercept the \(y\) -axis –above the source position–. This is not a real “time” - it is derived from the graph.
The velocities of the seismic layers and the layer thickness are obtained in the following manner.
Plot the times of first arrivals on an time-offset plot (“offset” is distance between source and geophone).
The direct arrivals are observed to lie along a straight line joining the origin. The slope of this line is \(1/v_1\) , giving the velocity of the upper layer.
The refracted arrivals appear as a straight line with smaller slope equal to \(1/v_2\) , giving the velocity of the lower layer.
For the refracted wave, this intercept time is
We therefore can obtain all three useful parameters about the earth, \((v_1, z, v_2)\) .
There is another useful point that is observable from the first arrival travel-time plot. We can often discern the crossover distance. Since this is the location where the direct wave and the refracted wave arrive at the same time, we can write
This can be used as a consistency check, or it can be used to compute one of the variables given values for two others.
Refracted ray in a three layered-earth 
The extension to more layers is in principle straight forward. Snell’s law holds for waves at all interfaces, so for a multi-layered medium
For a three layer case, the algebra is slightly more involved compared to a two layer example because we need to compute the times due to the ray path segments in the two top layers. Consider the diagrams below:
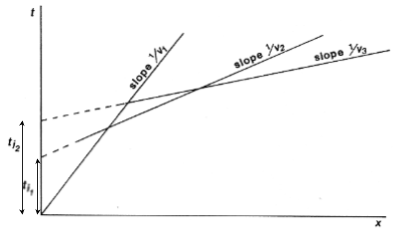
Using arguments that are entirely analagous to the two layer case (above) the travel time for the wave refracted at the top of layer three is given by
All quantities are defined in the diagrams, and the angles are
Note that \(\theta_2\) is a critical angle while \(\theta_1\) is not. You can prove the relation for \(\theta_1\) yourself by using Snell’s law at the two interfaces, and recalling that the angle of the ray coming from point \(B\) is the same as the angle arriving at point \(C\) . The straight line that corresponds to an individual refractor provides a velocity (from its slope) and a thickness (from the intercept). Thus the information on the above travel-time plot allows us to recover all three velocities and the thickness of both layers.
The travel time curves for multi layers are obtained from obvious extension of the above formulation.
Reflected rays - single layer 
Consider the situation to the right, in which there is a source \(S\) and a set of receivers on the surface of the earth. The earth is a single uniform layer overlying a uniform halfspace. A reflection from the interface will occur if there is a change in the acoustic impedance at the boundary.
Let \(x\) denote the “offset” or distance from the source to the receiver. The time taken for the seismic energy to travel from the source to the receiver is given by
\[t = \frac{(x^2 + 4z^2)^\frac{1}{2}}{v}\]
This is the equation of a hyperbola. In seismic reflection (as in radar) we plot time on the negative vertical axis, and so the seismic section (without the source wavelet) would look like.
Two way travel time:
Normal Moveout:
In the above diagram \(t_0\) is the 2-way vertical travel time. It is the minimum time at which a reflection will be recorded. The additional time taken for a signal to reach a receiver at offset \(x\) is called the “Normal Moveout” time, \(\Delta t\) . This value is required for every trace in the common depth point data set in order to shift echoes up so they align for stacking. How is it obtained? First let us find a way of determining velocity and \(t_0\) .
For this simple earth structure the velocity and layer thickness can readily be obtained from the hyperbola. Squaring both sides yields,
This is the equation of a straight line when \(t^2\) is plotted against \(x^2\) . Now, to find \(\Delta T\) , we must rearrange this hyperbolic equation relating \(t_0\) , \(x\) , the \(Tx\) – \(Rx\) offset, \(t\) at \(x\) , or \(t(x)\) , and the ground’s velocity, \(v\) .
Apply binomial expansion to get
Now, since normal moveout is \(\Delta T = t_x - t_0\)
The algebra has only one complicated step–a binomial expansion must be applied to obtain a simple relation without square roots etc.
The approximation is valid so long as the source-receiver separation (or offset) is “small” which means much less than the vertical depth to the reflecting layer (i.e. \(x << vt_0\) ). The result is a simple expression for normal moveout.
Each echo can be shifted up to align with the \(t_0\) position, so long as the trace position, \(x\) , the vertical incident travel time, \(t_0\) , and the velocity are known. Velocity can be estimated using the slope of the \(t^2\) – \(x^2\) plot, or with several other methods, which we will discuss in pages following.
Travel Time Curves for Multiple Layers 
If there are additional layers then the seismic energy at each interface is refracted according to Snell’s Law. The energy no longer travels in a straight line and hence the travel times are affected. It is observed that for small offsets, the travel time curve is still approximately hyperbolic, but the velocity, which controls the shape of the curve, is an “average” velocity determined from the velocities of all the layers above the reflector. The velocity is called the RMS (Root Mean Square) velocity, \(v_{rms}\) .
The complex travel path of a reflected ray through a multilayered ground. (b) The time–distance curve for reflected rays following the above type of path. Note that the divergence from the hyperbolic travel-time curve for a homogeneous overburden of velocity Vrms increases with offset.
As outlined in the figure above, the reflection curve for small offsets is still like a hyperbola, but the associated velocity is \(v_{rms}\) , not a true interval velocity.
For each hyperbola:
By fitting hyperbolas to each reflection event one can obtain \(t_n,v_n^{rms}\) for n = 1, 2, … The interval velocity and layer thickness of each layer can be found using the formulae below:
These formulae for the interval velocity and thickness of the \(n^{th}\) layer are directly obtainable from the definition of \(v_n^{rms}\) given above. The RMS velocity for the \(n^{th}\) layer is given by:
where \(v_i\) is the velocity of the \(i^{th}\) layer, and \(\tau_i\) is the one-way travel time through the \(i^{th}\) layer.
- Epicenter determine location of an earthquake
Epicenter: Determine Location of an Earthquake
How can you determine the epicenter of an earthquake?
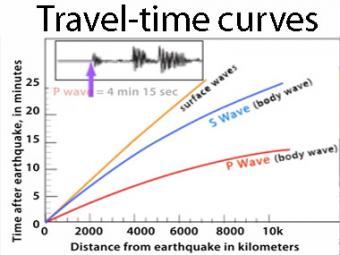
The arrival times of P and S waves are used to determine the distance to an earthquake using standard travel-time curves. P & S waves each shake the ground in different ways as they travel through the Earth. P waves are faster than S waves so by looking at seismograms, scientists can accurately locate the epicenter as well as the hypocenter, or focus of the earthquake at depth. (Recorded during a 2007 teacher workshop on earthquakes and tectonics. Speaker is Dr. Robert Butler, University of Portland Oregon)
- There is a predictable distance between the arrival of a P wave and the slower S wave
- Using the arrival times of the P and S waves from 3 different stations distances to epicenter can be determined.
- The intersection of the 3 cirles gives epicenter location.
Related Videos

Related Animations

We use exaggerated motion of a building (seismic station) to show how the ground moves during an earthquake, and why it is important to measure seismic waves using 3 components: vertical, N-S, and E-W. Before showing an actual distant earthquake, we break down the three axes of movement to clarify the 3 seismograms.
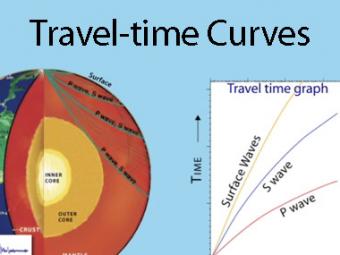
A travel time curve is a graph of the time that it takes for seismic waves to travel from the epicenter of an earthquake to the hundreds of seismograph stations around the world. The arrival times of P, S, and surface waves are shown to be predictable. This animates an IRIS poster linked with the animation.
The epicenter is the map location on Earth’s surface , above where earthquake began. An earthquake actually begins inside the earth at the hypocenter. Learn more!
Related Lessons

To understand plate tectonic processes and hazards, and to better understand where future earthquakes are likely to occur, it is important to locate earthquakes as they occur. In this activity students use three-component seismic data from recent earthquakes to locate a global earthquake.
We encourage the reuse and dissemination of the material on this site as long as attribution is retained. To this end the material on this site, unless otherwise noted, is offered under Creative Commons Attribution ( CC BY 4.0 ) license
- Mailing Lists
- Frequently Asked Questions
- Privacy Policy
- Terms of Service
- Comments about this page
- Instrumentation Services
- Data Services

UNIVERSITY OF WISCONSIN River Falls
Resources For
- Faculty/Staff
- Alumni/Friends
- Parents/Family
Quick Links
- Event Calendar
- Majors & Minors
- Graduate Programs
- Colleges & Departments
- Adult Education
- Academic Catalog
- Class Schedule
- Academic Support
- Visit Campus
- Incoming First Year
- International
- Graduate Admissions
- High School Credit Options
- Nondegree Seeking Students
- Student Success
- Housing & Dining
- Involvement Opportunities
- Sports & Recreation
- Student Employment
- Health & Wellness
- Safety & Security
- Parking & Transportation
- Services & Resources
- Falcon Athletics
- Athletics Schedule
- Purchase Tickets
- Camps & Clinics
- Maps & Directions
- Mission, Vision & Values
- UWRF History
- UWRF Leadership
- Retention and Success
- Your Right to Know
- Contact UWRF
- Career Success
- Geology Awards
- Geology Field Trips
- Geology Tools
Epicentral Distance & Phase Travel Time Calculator
Enter the latitudes and longitudes using decimal degrees and negative numbers to represent West and South directions.
+90 latitude is N to -90 latitude is S of equator; +180 longitude is E to -180 longitude is W of prime meridian.
The focal depth should be entered in km, where 0 = Surface Focus (do not enter negative values).
By: Tamara Cook - UWRF Geology Student (2013)
Enter the latitude and longitude of the earthquake and station and the focal depth of the earthquake.

- Request Info
- Apply to UWRF
- Give to UWRF
- A to Z Search
- Maps/Directions
- Accessibility
- Emergency Alert
If you are unable to retrieve web content in an accessible format, please contact [email protected]
University of Wisconsin-River Falls · 410 S. 3rd Street, River Falls WI 54022 USA · Campus Information 715-425-3911

An official website of the United States government
Here's how you know
Official websites use .gov A .gov website belongs to an official government organization in the United States.
Secure .gov websites use HTTPS A lock ( ) or https:// means you’ve safely connected to the .gov website. Share sensitive information only on official, secure websites.

- Digg
Latest Earthquakes | Chat Share Social Media
Why do earthquakes occur in the middle of the continent far from plate boundaries?
Most earthquakes occur near tectonic plate boundaries, where the Earth's crust is composed of large fragments that interact with one another. These interactions can involve plates sliding past each other, colliding, or moving apart. However, a map of the U.S. shows that earthquakes also take place in the interior regions of the continent, though less frequently than those along the edges. This raises the question: why do earthquakes occur away from tectonic plate boundaries? Research into this phenomenon is limited, but studies indicate that ancient regional and local variations in the Earth's crust play a significant role. These variations reflect stress conditions that have persisted for millions of years, often stemming from long-ago tectonic activities such as mountain-building and continental rifting. Stress is continuously transmitted from the boundaries throughout the tectonic plates. When this stress encounters a pre-existing weakness in the crust—such as fractures or faults from older geological events—the likelihood of an earthquake occurring in that location increases.
Learn More:
- A Possible Cause of Earthquakes in the Continental Interior
- This Dynamic Planet - World Map of Volcanoes, Earthquakes, Impact Craters, and Plate Tectonics
- This Dynamic Earth: the Story of Plate Tectonics
Related Content
- Publications

What is an earthquake and what causes them to happen?
An earthquake is caused by a sudden slip on a fault. The tectonic plates are always slowly moving, but they get stuck at their edges due to friction. When the stress on the edge overcomes the friction, there is an earthquake that releases energy in waves that travel through the earth's crust and cause the shaking that we feel. In California there are two plates - the Pacific Plate and the North...

Why should people in the eastern United States be concerned about earthquakes?
1) Severe earthquakes have occurred in the eastern U.S.: In November of 1755, an earthquake with an estimated magnitude of 6.0 and a maximum intensity of VIII occurred about 50 miles northeast of Boston, Massachusetts. Boston was heavily damaged. Other strong earthquakes recorded in the continental US were centered in southeastern Missouri near the border with Arkansas, Kentucky and Tennessee. In...

Where are the faults in the Central and Eastern U.S.?
Faults vs. Fault Lines on a Map In order to answer this question, we first need to explain some basics about faults. Faults are different from fault lines. A fault is a three-dimensional surface within the planet that might extend up to the surface or might be completely buried. In contrast, a fault line is where the fault cuts the Earth's surface… if indeed it does. The most prominent faults in...

What is a fault and what are the different types?
A fault is a fracture or zone of fractures between two blocks of rock. Faults allow the blocks to move relative to each other. This movement may occur rapidly, in the form of an earthquake - or may occur slowly, in the form of creep. Faults may range in length from a few millimeters to thousands of kilometers. Most faults produce repeated displacements over geologic time. During an earthquake, the...

Where can I find a fault map of the United States? Is one available in GIS format?
An online map of United States Quaternary faults (faults active in the last 1.6 million years which places them within the Quaternary Period) is available via the Quaternary Fault and Fold Database . There is an interactive map application to view the faults online and a separate database search function. KML (Google Earth-type) files and GIS shape files are also available for download from the...

USGS deploys “aftershock kits” to study Whitehouse Station earthquakes
A technician installs strong motion and high frequency sensors April 11 at a station selected to record aftershock data from the April 5, 2024 Whitehouse Station, N.J. earthquake.
![National Preparedness Month Spotlight on Earthquakes [Part 1] Video of Earth with a glowing crack through it.](https://d9-wret.s3.us-west-2.amazonaws.com/assets/palladium/production/s3fs-public/styles/masonry/public/media/images/video1_0.jpg?itok=D37v6dWO)
National Preparedness Month Spotlight on Earthquakes [Part 1]
Earthquakes can affect millions of people across the United States. But do you know what causes them? This video will tell you.
September is National Preparedness Month. Learn more about the natural hazards you may face in our feature story .
New Madrid Seismic Zone
The New Madrid seismic zone in Central U.S.
A seismic zone is an area of seismicity probably sharing a common cause.
Fault Types
Strike-slip, normal, and reverse faults. A reverse fault with a small dip angle is called a thrust fault.

When landmasses collide, rock layers can break. Geologists call these breaks "faults." Rock layers are offset in this image in western China, making the faults remarkably clear. The different colors indicate rocks that formed at different times and in different environments.

Low-Flying Airplane Maps New Madrid Zone
Starting around July 10, 2013, an airplane operating under contract to the USGS will be making low-level flights over a 1400-square-mile area in the New Madrid Seismic Zone. This airplane is a Cessna-180, specially modified for low-altitude geophysical surveys.

Tish Tuttle: Prehistoric New Madrid Earthquakes
Description available soon
Earthquake rupture forecast model construction for the 2023 U.S. 50‐State National Seismic Hazard Model Update: Central and eastern U.S. fault‐based source model
Sediment thickness map of united states atlantic and gulf coastal plain strata, and their influence on earthquake ground motions, magnitude conversion and earthquake recurrence rate models for the central and eastern united states, quaternary reelfoot fault deformation in the obion river valley, tennessee, usa, pore pressure threshold and fault slip potential for induced earthquakes in the dallas-fort worth area of north central texas.
Earthquakes were induced in the Fort Worth Basin from 2008 through 2020 by increase in pore pressure from injection of oilfield wastewater (SWD). In this region and elsewhere, a missing link in understanding the mechanics of causation has been a lack of comprehensive models of pore pressure evolution (ΔPp) from SWD. We integrate detailed earthquake catalogs, ΔPp, and probabilistic fault slip poten
The liquefaction record of past earthquakes in the Central Virginia Seismic Zone, Eastern United States
WHITEHOUSE STATION, N.J. – A U.S. Geological Survey team has begun a seismic sensor deployment in an effort to capture aftershock data following the 4...
Aftershocks? Swarm? What is the difference, and what do they mean?
In Yellowstone, we often talk about earthquake swarms. But especially in recent weeks, we’ve also discussed aftershock sequences. What is the...
Threat of Earthquakes Occurring in Central United States Still Alive
Earthquake activity in the New Madrid Seismic Zone in the central United States does not seem to be slowing down. In a new study published in the...

IMAGES
COMMENTS
Travel time curves of earthquakes. (Public domain.) Table of P and S-P versus distance. P and S-P travel times as a function of source distance for an earthquake 33 km deep. The Time of the first arriving P phase is given, along with the time difference between the S and P phases. The latter time is known as the S minus P time.
Travel time in seismology means time for the seismic waves to travel from the focus of an earthquake through the crust to a certain seismograph station. [1] Travel-time curve is a graph showing the relationship between the distance from the epicenter to the observation point and the travel time. [2] [3] Travel-time curve is drawn when the vertical axis of the graph is the travel time and the ...
Learn more: www.iris.edu/earthquakeA travel-time curve is a graph of the time that it takes for seismic waves to travel from the epicenter of an earthquake s...
A travel time curve is a graph of the time that it takes for seismic waves to travel from the epicenter of an earthquake to seismograph stations at varying distances away. The velocity of seismic waves through different materials yield information about Earth's deep interior. IRIS' travel times graphic for the 1994 Northridge, CA earthquake ...
distance traveled from epicenters is shown on the x‐axis. Characteristic travel‐time curves for P‐ and S‐waves are also provided. As shown in Figure 10, the vertical distance separating the two curves is the S‐P interval. Figure 10. Travel‐time graph for earthquake shown in Figure 9.
A travel-time curve is a graph of the time that it takes for seismic waves to travel from the epicenter of an earthquake (time and distance = zero) to seismograph stations varying distances away. The curves are the result of analyzing seismic waves from thousands of earthquakes, received by hundreds of seismic stations around the world.
An animation showing how to read travel-time curves. More details at http://www.iris.edu/hq/programs/education_and_outreach/aotm/9
The simplest method of locating an earthquake on a globe is to find the time interval between the P- and S-wave arrivals at several seismograph stations. ... for example, travel-time tables and travel-time curves for that depth have to be used to calculate the origin time and distances. Other wave types can be generated inside the Earth by P ...
A travel time curve is a graph of the time that it takes for seismic waves to travel from the epicenter of an earthquake to seismograph stations at varying distances away. The velocity of seismic waves through different materials yield information about Earth's deep interior. IRIS' travel times graphic for the 1994 Northridge, CA earthquake ...
A travel time curve is a graph of the time that it takes for seismic waves to travel from the epicenter of an earthquake to the hundreds of seismograph stations around the world. The arrival times of P, S, and surface waves are shown to be predictable. This animates an IRIS poster linked with the animation.
A travel time curve is a graph of the time that it takes for seismic waves to travel from the epicenter of an earthquake to the hundreds of seismograph stations around the world. The arrival times of P, S, and surface waves are shown to be predictable. This animates an IRIS poster linked with the animation.
Travel-Time Curves. For this simple model under consideration, we can compute what the arrival times of the various seismic waves should be and overlay these predicted arrival times on top of our shot record. As expected, the first arrival at short offsets is the direct arrival. This arrival has a very large amplitude and its moveout is ...
When an earthquake or explosion occurs, part of the energy released is as elastic waves that are transmitted through the earth. ... Therefore, the asymptote for the travel time curve has a slope of the reciprocal of the velocity. Another approach to analysing the data is to get v elocity and thickness from a plot of x 2 v t 2. Now recall: By ...
Travel Times Curves. High resolution graph in pdf format (1MB) Earthquake Travel Time Information and Calculator Home Page. USGS Earthquake Hazards Program, responsible for monitoring, reporting, and researching earthquakes and earthquake hazards.
The travel time curves for these ray paths are shown below, where the horizontal axis represents distance from the source along the flat surface of the earth, \(x_{crit}\) is called the critical distance, and \(x_{cross}\) the crossover distance. The critical distance is the closest surface point to the source at which the refracted ray can be ...
Calculator: Generate a listing of phase arrival times at YOUR seismic station. Recent Earthquakes. Specify Earthquake. Graph of seismic travel time in minutes versus distance in degrees for an earthquake at the Earth's surface. Table of P and S minus P times versus distance in degrees. Composite ANSS list of earthquakes for the past 14 days.
C3.1.2 Travel time curve for uniform velocity, spherical Earth • 1883 John Milne speculated that "it is not unlikely that every large earthquake might with proper appliances be recorded at any point of the globe" • First teleseismic signal observed in 1889 when waves from an earthquake in Japan were recorded in Germany.
A travel time curve is a graph of the time that it takes for seismic waves to travel from the epicenter of an earthquake to the hundreds of seismograph stations around the world. The arrival times of P, S, and surface waves are shown to be predictable. This animates an IRIS poster linked with the animation.
Travel Time Curve. In this activity you will construct a Travel-Time Graph for seismic waves similar to the one shown below. This graph will be used to determine the distance to an epicenter based on the amount of time that earthquake waves have traveled.
Latest Earthquakes Live WebChat; Share Social Media Facebook Twitter Linkedin Digg Reddit Pinterest Email; Breadcrumb. Images; Charts or Graphs Travel Time Curves By Earthquake Hazards Program. Original Thumbnail Medium. Detailed Description. Travel time curves of earthquakes. Sources/Usage. Public Domain. Explore Search. Natural Hazards; View ...
Epicentral Distance & Phase Travel Time Calculator. Enter the latitudes and longitudes using decimal degrees and negative numbers to represent West and South directions. +90 latitude is N to -90 latitude is S of equator; +180 longitude is E to -180 longitude is W of prime meridian. The focal depth should be entered in km, where 0 = Surface ...
Null Page. Virtual Courseware : Earthquake : Travel Time Graph. In this activity you will construct a Travel-Time Graph for seismic waves similar to the one shown below. This graph will be used to determine the distance to an epicenter based on the amount of time that earthquake waves have traveled.
1. Use simulated data to construct a travel-time graph for seismic waves. 2. Explain the relationship between the distance to an earthquake epicenter and the amount of time earthquake (seismic) waves travel. 3. Simulate an earthquake and use seismograms to determine the location of the earthquake's epicenter and estimate its Richter magnitude.
Most earthquakes occur near tectonic plate boundaries, where the Earth's crust is composed of large fragments that interact with one another. These interactions can involve plates sliding past each other, colliding, or moving apart. However, a map of the U.S. shows that earthquakes also take place in the interior regions of the continent, though less frequently than those along the edges.