
57 UNDERSTANDING TOURIST BEHAVIOR IN A CHANGING ENVIRONMENT – Contributions by Astrid Kemperman
The travel and tourism industry is among the most affected sectors by the Covid-19 pandemic, with a massive fall in international tourism demand. While the industry is currently recovering, the World Tourism Organization argues that this fall in demand offers the opportunity to rethink the tourism sector and build back better towards a more sustainable, inclusive, and resilient sector that ensures that the benefits of tourism are enjoyed widely and fairly (UNWTO, 2021). Over the last decades, it has become clear that the growth of tourism brings significant challenges with it and is itself also influenced by for example climate change, pollution, decreasing natural resources, growing populations, and local and cultural differences. The negative environmental impacts of tourism are substantial: tourism puts stress on local land use, can lead to increased pollution, and more pressure on endangered species and the natural habitat. A more sustainable tourism approach would mean taking into account the current and future economic, social and environmental impacts, the preferences and needs of visitors, the industry, the environment, and host communities (UNWTO, 2021).
At the same time, recent technological and digital innovations also change the way people live, work, travel, interact with one another, and how they spend their free time. The borders between the digital, social, and physical environment are more and more intertwined. Technological advances, information dissemination, the influence of social networks, and increasing available free time and monetary budgets have further strengthened the need to create sustainable development opportunities for the tourism industry to support and improve efficient destination planning, management, and local community empowerment and inclusiveness. Moreover, as argued by Gretzel and Koo (2021), these technological developments lead to a convergence of urban residential and touristic spaces, and there is value in merging so-called smart tourism and smart city planning and management development goals to serve both residents and tourists in the best possible ways.
Research is needed to test the possible impact of new technology on tourists, their needs, preferences and activities, social relationships, and interaction with the environment. These considerations drive my general research aim: to develop a deeper understanding of individuals’ needs, preferences, and spatial activity patterns within the context of the digital, social, and physical environment to help find solutions for these challenging problems. In this chapter, a concise overview of my research, from the past to present and some new ideas are presented and discussed, as shown in figure 1: investigating tourist choice behavior within a changing digital, social and physical environment to support planning and design of environments that enhance tourist experiences and quality of life.

Facets of tourist choice behavior
Central in my research over the years is understanding and adding to knowledge on tourist choice behavior, and I have been doing so taking a quantitative research approach using advanced data collection methods (e.g., dynamic stated choice experiments) and modeling approaches (e.g., discrete choice modeling, Bayesian Belief Network models). Tourists make a variety of choices including whether or not to travel, destination choice (e.g., Kemperman, Borgers & Timmermans, 2002b), transport mode choice (e.g., Grigolon, Kemperman & Timmermans, 2012c), accommodation choice (e.g., Randle, Kemperman & Dolnicar, 2019), trip duration choice (e.g., Kemperman, Borgers, Oppewal & Timmermans, 2003), and what activities to undertake while at a specific destination (e.g., Kemperman, Joh, & Timmermans, 2004). However, when explaining and predicting tourist choice behavior a variety of unique properties need to be taken into account. Over the years I have investigated some of these aspects.
First, compared to other types of choices like transport mode choice, tourists are inclined to show variety-seeking behavior in their choices over time, meaning that a time-invariant preference function is not reasonable (Kemperman, 2000). Variety seeking behavior in tourists may be influenced by a variety of factors such as availability of choice alternatives or changes in their characteristics, differences in decision-making contexts, different choice motivations, different travel party group composition or travel companions, and in general a basic desire for novelty (Kemperman, Borgers, Oppewal and Timmermans, 2000). Specifically, a discrete choice model of theme park behavior including seasonal and variety-seeking effects is proposed and estimated and the external validity of the model is assessed leading to accept the hypothesis that tourists differ in their preferences for theme parks by season and show variety-seeking behavior over time (Kemperman, Borgers & Timmermans, 2002b).
In general, tourist choices, certainly compared to for example commuter choices, are made less frequently, represent high-involvement decisions, often include multiple choice facets, the decision process may take longer, and they might be based on well-established long-term agendas (Grigolon, 2013). A portfolio choice experiment concerning the combined choice of destination type, transport mode, duration, accommodation, and travel party for vacations is developed (Grigolon, Kemperman & Timmermans, 2012b). Specifically, the influence of low-fare airlines on the portfolio of vacation travel decisions of students is investigated. The findings confirm earlier studies that conclude that travel-related decisions for tourists, in general, are multi-faceted and not only related to the destination itself (e.g., Dellaert, Ettema, & Lindh, 1998; Jeng & Fesenmaier, 1997; Woodside & MacDonald, 1994).
In another study, based on revealed data about vacation history in terms of the long holidays of a sample of students, interdependencies in the vacation portfolios and their covariates are explored using association rules (Grigolon, Kemperman & Timmermans, 2012a). The portfolios include joint combinations of destination, transport mode, accommodation type, duration of the trip, length of stay, travel party, and season. Results show and confirm dependencies between vacation portfolio choice facets and their covariates. These insights provide a better understanding of tourist choice behavior and the context in which choices are made and can support policy and planning decision-making.
Tourist activity choices
When tourists are at a destination or in a city there is the timing and sequencing of tourists’ activity choices. Over-usage and congestion of specific attractions or facilities are difficult to avoid and may cause severe problems for a destination or city. For destination planning and management, it is important to understand how tourists behave in time and space, how the demand for various activities and attractions fluctuate over time, and how they can be accommodated and directed.
One of my first studies on this topic (Kemperman, Borgers & Timmermans, 2002a) introduces a semi-parametric hazard-based duration model to predict the timing and sequence of theme park visitors’ activity choice behavior that is estimated based on observations of tourist activity choices in various hypothetical theme parks. The activities include a description of the activity/attraction as well as their waiting time, activity duration, and location. The main findings support the prediction of how the demand for various activities is changing during the day and how the visitors are distributed over the activities in the park during the day. This information is relevant for visitor use planning to optimize the theme park experience.
In another study on visitors’ activities undertaken while tourists are at a destination, we focus on interrelated choices of tourists, multi-dimensional activity patterns as opposed to particular isolated facets of such patterns (Kemperman, Joh, & Timmermans, 2004). Moreover, in this study, it is tested whether activity patterns of first-time visitors tend to differentiate from the activity patterns of repeat visitors, mediated by their use of information. Differences between the two groups are assumed to be reduced when first-time visitors use information about the available activities and the spatial layout of the theme park. Specifically, the sequence alignment method is applied to capture the sequence of conducted activities. We conclude that the activity patterns of the two groups do differ, first-time visitors follow a very strict route in the park as indicated by the theme park, while repeat visitors have a more diverse order in their activity pattern. However, the difference between the two groups is reduced when first-time visitors use information about the available activities and the spatial layout of the park.
In an aim to measure and predict tourists’ preferences for combinations of activities to participate in during a city trip, a personalized stated choice experiment is developed and binary mixed logit models are estimated on the choice data collected (Aksenov, Kemperman & Arentze, 2014). An advantage of this approach is that it allows estimation of covariances between city trip activities indicating whether they would act as complements or substitutes for a specific tourist in his/her city trip activity program. The model provides information on combinations of activities and themes that tourists prefer during their city trip and that can be used to further fine-tune the recommendations of city trip programs and optimize the tourist experience.
As shopping is one of the most important activities for tourists, we also investigate shopping route choice behavior in a downtown historic center, including the motivation for the shopping trip, familiarity with the destination, and whether the shopping route through the downtown area is planned or not before the visit (Kemperman, Borgers, & Timmermans, 2009). A model of tourist shopping behavior is proposed and estimated to investigate differences in route choice behavior of various types of tourist shoppers. The results indicate that shopping supply and accessibility, some physical characteristics, and the history of the route followed are important factors influencing route choice behavior. Furthermore, it can be concluded that shopping motivations, familiarity with the area, and planning of the route affect tourist route choice behavior. The model allows investigating the effects of environmental characteristics on route choice behavior and assessing various future planning scenarios, such as changes in physical aspects in the downtown area, or changes in the supply of shops to optimize visitors’ shopping trips.
Social and physical environment and tourist choice behavior
The social environment including the social relationships and cultural milieus within which tourists interact and make their choices is intertwined with the physical, natural, and built environment in which tourists travel and their activities take place.
First, a study in which we explore children’s choices to participate in recreational activities and the extent to which their choices are influenced by individual and household socio-demographics, and characteristics of the social and physical environment (Kemperman & Timmermans, 2011). Travel and activity diaries of a large sample of children aged 4-11 years old in the Netherlands are used to collect data on out-of-home recreational activity choices and this data is merged with measures describing the social and physical living environment. A Bayesian belief network modeling approach is used to simultaneously estimate and predict all direct and indirect relationships between the variables. Results indicate that recreational activity choices are, among others, directly related to the socio-economic status of the household, the perceived safety of the neighborhood, and the land use in the neighborhood. Planners and designers are recommended to find a good land use mix, and specifically, make sure that they focus their attention on safety issues to stimulate children’s recreational activity choices.
In a more recent study, we investigate with a stated choice experiment how different presentations of cause-related corporate social responsibility (CSR) initiatives affect holiday accommodation choices, with a specific focus on the relative importance of tourist involvement, the message-framing, and the donation proximity (Randle, Kemperman, & Dolnicar, 2019). In a tourism context, we see that an increasing number of organizations implement so-called social corporate responsibility (CSR) initiatives, meaning they give some of their benefits back to the local community, society and, or the environment and it is of interest to see whether tourists take these initiatives into account when making their choices and how messages are valued. We found that different market segments are affected differently by these SCR initiatives when choosing their holiday accommodation. Specifically, there is one CSR-sensitive segment that cares about nature and the natural landscape, experiencing nature intensely, and efforts to maintain unspoiled surroundings and scores higher on community involvement than other segments. In general, it is found that negative message framing is the most promising option in terms of positively influencing tourist choices. It is concluded that although CSR initiatives do not appear to have a consistently positive effect on all tourist accommodation choice behavior, neither do they negatively affect demand. Specifically, it is advised to tailor CSR messages such that they are most effective in influencing the SCR-sensitive tourist segment.
Tourism can have an enormous environmental impact, and specifically, air travel negatively contributes to global carbon emissions. A voluntary carbon offset program supports airlines to take proactive measures to reduce the environmental impact. We have tested, using a stated choice experiment, the effectiveness of different communication messages to increase voluntary purchasing of carbon offsets by air passengers (Ritchie, Kemperman, & Dolnicar, 2021). Results indicate that tourists who book their flights prefer carbon offset schemes that fund local programs over international ones, that are effective in mitigating emissions, and are accredited. The willingness to pay for carbon offsets when booking for a group is lower than when booking an individual flight for oneself. Moreover, the tourist market can be divided into different segments with their characteristics, including age, employment status, frequent flyer membership, and flight behavior. Therefore, it is important to target the segments for aviation carbon offsetting by matching certain types of attributes and present an optimal program to each of the segments.
Integration of the digital environment in tourist choice behavior
Nowadays digital technologies can support tourists in making their choices, planning their trips, and optimizing their experiences (e.g., Buhalis, 1998; Gretzel, Mitsche, Hwang & Fesenmaier, 2004; Kemperman, Arentze, & Aksenov, 2019; Rodriguez, Molina, Perez & Caballero, 2012; Steen Jacobsen & Munar, 2012). We introduce this concept of ‘smart routing’ in the development of a recommender system for tourists that takes into account the dynamics of their personal user profiles (Aksenov, Kemperman, & Arentze, 2016). This smart routing concept relies on three levels of support for the tourist: 1) programming the tour (selecting a set of relevant activities and points of interests to be included in the tour, 2) scheduling the tour (arranging the selected activities and point of interests into a sequence based on the cultural, recreational and situational value of each) and 3) determining the tour’s travel route (generating a set of trips between the activities and point of interests that the tourist needs to perform to complete the tour). This approach aims to enhance the experience of tourists by arranging the activities and points of interest together in a way that creates a storyline that the tourist will be interested to follow and by reflecting on the tourists’ dynamic preferences.
For the latter, an understanding of the influence of a tourist’s affective state and dynamic needs on the preferred activities is required (Arentze, Kemperman, & Aksenov, 2018). Finally, the activities and points of interest are connected by a chain of multimodal trips that the tourist can follow, also in relation to their preferences and dynamic needs. Therefore, each tour can be personalized in a ‘smart’ way optimizing the overall experience of the trip. In the study, the building blocks of this concept are discussed in detail and the data involved, and finally, a prototype of the recommender system is developed.
C onclusion and future research
This chapter gives an overview of research that I have worked on over the years in collaboration with other researchers to develop a deeper understanding of tourists’ choice behavior and to generate insights and provide support for policy, planning, and managerial decision making in finding answers to the challenges the tourism industry and environment are facing. Specifically, examples of research are presented that tested in different ways facets of tourists’ needs, preferences, and spatial activity patterns within the context of a changing digital, social and physical environment.
Based on this overview some avenues for future research, in line with the presented framework in Figure 1, can be given. First, the studies presented show how tourist choices are influenced by their social and physical environment and that in understanding these choices it is important to take these aspects into account. Specifically, the social environment or social influence by family members, peers, or colleagues might also be an important additional explanatory facet in explaining tourist choices, for example in understanding and promoting the choice for sustainable tourist behavior. Research has also indicated that role of social media, online reviews, and social influencers have become increasingly important in the choices tourists make, and including the influence of someone’s social network, colleagues, peers, and family members in predicting tourist choice behavior is an interesting research opportunity (Kemperman, 2021).
The digital and technological developments support and improve other ways of data collection, for example by using virtual reality, simulators, or eye-tracking (e.g., Cherchi and Hensher, 2015; Kemperman, 2021). Tourists are often unfamiliar with a specific destination or tourist service, and therefore presenting them with more visual, virtual reality or interactive choice options might be of interest to better measure their preferences and choice behavior. Moreover, virtual or augmented reality environments also allow testing the effects of interventions on tourist preferences and behavior before they are actually implemented. This is an advantage, specifically when high investments are involved.
Moreover, technological innovations support the collection of more and more types of so-called big data and this data can be very useful in tourism research (Li, Xu, Tang, Wang, & Li, 2018). Big data sources for tourism research come in a variety of forms, such as user-generated data (e.g., tweets, online photos), device data (e.g., GPS data, mobile phone data), and transaction data (e.g., online booking data, customer cards). These types of smart big data sources might be used to understand how inner-city visitors’ activity choices emerge and evolve in space and time to provide city managers and planners with important information for future management and planning such as visitor flows and clusters, and interesting locations (e.g., Beritelli, Reinhold & Laesser, 2020).
Finally, to conclude, there is a challenge for more research and evidence to further expand knowledge on tourist choice behavior and support optimizing tourists’ experiences and quality of life.
Written by Astrid Kemperman, Eindhoven University of Technology, The Netherlands
Aksenov, P., Kemperman, A.D.A.M., & Arentze, T.A. (2014). Toward personalized and dynamic cultural routing: A three-level approach. Procedia Environmental Sciences, 22 , 257-269.
Aksenov, P., Kemperman, A., & Arentze, T. (2016). A Personalised Recommender System for Tourists on City Trips: Concepts and Implementation. In De Pietro, G., Gallo, L., Howlett, R.J., Jain, L.C. (eds): Intelligent Interactive Multimedia Systems and Services 2016 , Springer International Publishing Switzerland, 525-535.
Arentze, T., Kemperman, A. & Aksenov, P. (2018). Estimating a latent-class user model for travel recommender systems. Information Technology & Tourism, 19( 1-4), 61-82.
Beritelli, P., Reinhold, S., & Laesser, C. (2020). Visitor flows, trajectories and corridors: Planning and designing places from the traveler’s point of view. Annals of Tourism Research, 82, https://doi.org/10.1016/j.annals.2020.102936.
Buhalis, D. (1998). Strategic use of information technologies in the tourism industry. Tourism Management, 19 (5), 409-421.
Cherchi, E., & Hensher, D. A. (2015).Workshop synthesis: Stated preference surveys and experimental design, an audit of the journey so far, and future research perspectives. Transportation Research Procedia, 11 , 154–164.
Dellaert, B. G. C., Ettema, S. D. F., & Lindh, C. (1998). Multi-faceted tourist travel decisions: A constraint-based conceptual framework to describe tourists’ sequential choices of travel components. Tourism Management, 19, 313–320.
Gretzel, U. & Koo, C. (2021). Smart tourism cities: a duality of place where technology supports the convergence of touristic and residential experiences. Asia Pacific Journal of Tourism Research, 26 (4), 352-364.
Gretzel, U., Mitsche, N., Hwang, Y.H., & Fesenmaier D.R. (2004). Tell me who you are and I will tell you where to go: Use of travel personalities in destination recommendation systems. Information Technology & Tourism, 7 , 3–12.
Grigolon A.B., Kemperman A.D.A.M., & Timmermans, H.J.P. (2012a). Exploring interdependencies in students’ vacation portfolios using association rules. European Journal of Tourism Research, 5( 2), 93-105.
Grigolon A.B., Kemperman A.D.A.M., & Timmermans, H.J.P. (2012b). The influence of low-fare airlines on vacation choices of students: Results of a stated portfolio choice experiment. Tourism Management, 33 , 1174-1184.
Grigolon A.B., Kemperman A.D.A.M., & Timmermans, H.J.P. (2012c). Student’s vacation travel: A reference dependent model of airline fares preferences. Journal of Air Transport Management, 18 (1), 38-42.
Grigolon, A. (2013). Modeling Recreation Choices over the Family Lifecycle. Ph.D Thesis, Eindhoven University of Technology, Eindhoven.
Jeng, J.M. & Fesenmaier, D.R. (1998), Destination Compatibility in Multidestination Pleasure Travel. Tourism Analysis, 3 , 77-87.
Kemperman A.D.A.M., & Timmermans, H.J.P. (2011). Children’s recreational physical activity. Leisure Sciences, 33 (3), 183-204.
Kemperman A.D.A.M., Borgers A.W.J., & Timmermans, H.J.P. (2002a). A semi-parametric hazard model of activity timing and sequencing decisions during visits to theme parks using experimental design data. Tourism Analysis, 7, 1-13.
Kemperman A.D.A.M., Borgers A.W.J., & Timmermans, H.J.P. (2002b). Incorporating Variety-Seeking and Seasonality in Stated Preference Modeling of Leisure Trip Destination Choice: A Test of External Validity. Transportation Research Record, 1807 , 67-76.
Kemperman A.D.A.M., Borgers A.W.J., & Timmermans, H.J.P. (2009). Tourist shopping behavior in a historic downtown area. Tourism Management, 30 (2), 208-218.
Kemperman A.D.A.M., Borgers A.W.J., Oppewal H. & Timmermans, H.J.P. (2003). Predicting the duration of theme park visitors’ activities: An ordered logit model using conjoint choice data. Journal of Travel Research, 41 (4), 375-384.
Kemperman A.D.A.M., Borgers A.W.J., Oppewal H., & Timmermans, H.J.P. (2000). Consumer Choice of Theme Parks: A Conjoint Choice Model of Seasonality Effects and Variety Seeking Behavior . Leisure Sciences, 22 , 1-18.
Kemperman A.D.A.M., Joh C.H., & Timmermans, H.J.P. (2004). Comparing first-time and repeat visitors activity patterns. Tourism Analysis, 8 (2-4), 159-164.
Kemperman, A. (2000). Temporal aspects of theme park choice behavior. Modeling variety seeking, seasonality and diversification to support theme park planning, Ph.D Thesis, Eindhoven University of Technology, Eindhoven.
Kemperman, A. (2021). A review of research into discrete choice experiments in tourism – Launching the Annals of Tourism Research curated collection on discrete choice experiments in tourism. Annals of Tourism Research, 87, https://doi.org/10.1016/j.annals.2020.103137.
Kemperman, A., Arentze, T., & Aksenov, P. (2019). Tourists’ City Trip Activity Program Planning: A Personalized Stated Choice Experiment. In Artal-Tur, A., Kozak, N., Kozak, M. (eds): Trends in Tourist Behavior: New Products and Experiences in Europe , Springer, Springer Nature Switzerland
Li, J., Xu, L., Tang, L., Wang, S., & Li, L. (2018). Big data in tourism research: A literature review. Tourism Management, 68 , 301-323.
Randle, M., Kemperman, A., & Dolnicar S. (2019). Making cause-related corporate social responsibility (CSR) count in holiday accommodation choice. Tourism Management, 75 , 66-77.
Ritchie, B.W., Kemperman, A., & Dolnicar, S. (2021). Which types of product attributes lead to aviation voluntary carbon offsetting among air passengers? Tourism Management, 85, https://doi.org/10.1016/j.tourman.2020.104276 .
Rodríguez, B., Molina,J., Pérez, F., & Caballero, R. (2012). Interactive design of personalised tourism routes. Tourism Management, 33 (4), 926-940.
Steen Jacobsen, J.K., & Munar, A.M. (2012). Tourist information search and destination choice in a digital age. Tourism Management Perspectives, 1 (1), 39-47.
UNWTO (2021). COVID-19 response. Retrieved from https://www.unwto.org/tourism-covid-19
Woodside, A.G. & MacDonald, R. (1994), General System Framework of Customer Choice Processes of Tourism Services, in R. Gasser and K. Weiermair (eds.), Spoilt for Choice, Kultur Verlag, Austria.
Women’s voices in tourism research Copyright © 2021 by The University of Queensland is licensed under a Creative Commons Attribution 4.0 International License , except where otherwise noted.
Share This Book

Tourists behaving badly: how culture shapes conduct when we’re on holiday

Assistant Professor, Hong Kong Polytechnic University

PhD researcher, Hong Kong Polytechnic University

Disclosure statement
The authors do not work for, consult, own shares in or receive funding from any company or organisation that would benefit from this article, and have disclosed no relevant affiliations beyond their academic appointment.
View all partners
There appears to be increasing tension between tourists and residents around the world, with the former often blamed for behaving inappropriately and disturbing locals. Protests against tourist behaviour have erupted in Barcelona , Venice and Hong Kong .
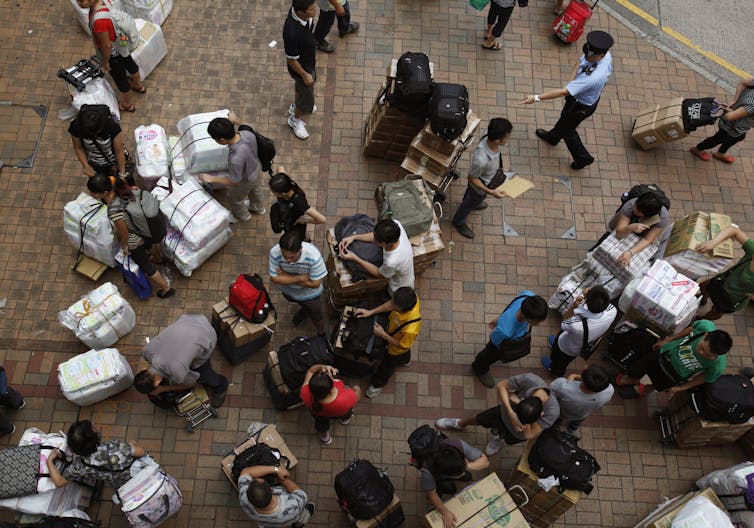
In Hong Kong, tourists are blamed for being noisy, inconsiderate, urinating in public, buying up necessities such as baby milk powder, and generally not following local customs. Chinese tourists, in particular, face harsh criticism in Hong Kong as well as in Thailand .
In Spain, British tourists are often blamed for poor behaviour.
But tourists’ ethics are rarely studied, and many questions about their behaviour remain unanswered. These include whether tourists have different moral values than local residents; if visitors from different parts of the world have different moral values; and whether people are more likely to participate in morally dubious activities while on holidays than where they live.
What we did
In a recently published study , we suggest that, at least in Hong Kong, there may indeed be differences between ethical judgements of tourists from different regions and local residents.
We undertook a survey of mainland Chinese tourists, Western tourists and Hong Kong residents, and asked to identify how morally acceptable five different scenarios were.
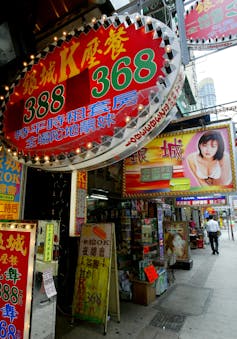
Our scenarios were: purchasing counterfeit products, disorderly behaviour in public due to drunkenness, jumping queues, lying about a child’s age (to get discounts) and using the services of a prostitute.
We then applied a Multidimensional Ethics Scale to find out more precisely how acceptable these scenarios were to respondents. This widely-used scale uses several normative ethics theories to understand ethical judgements.
We then asked the respondents whether they were likely to engage in these activities at home and on holidays.
Fish out of water
The case of tourist behaviour is especially interesting for debates about ethical decision-making. At home, we may be bound to behave in a certain manner due to societal pressures. We may feel judged by relatives, friends or colleagues. And we may think that somebody who knows us will easily find out about our misbehaviour. Our actions may have long-lasting consequences.
But these pressures are removed when we travel overseas to places where no one knows us and where we don’t stay for long. Tourism, then, may be thought of as an egoistic and indulgent activity.
At least, that’s the theory.
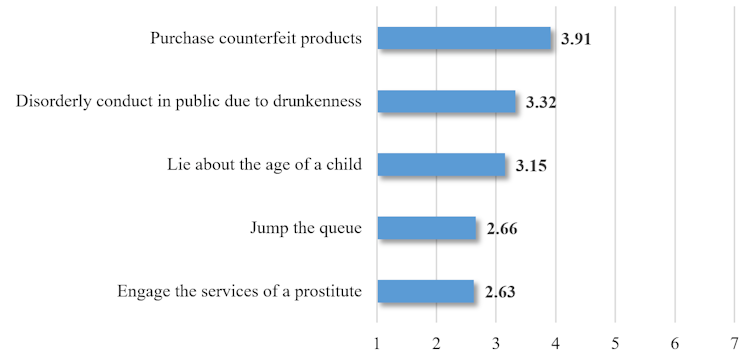
Overall, engaging the services of a prostitute and jumping queues were the least acceptable to all respondents, while purchasing counterfeit products was the most acceptable.
We found it surprising that two such different activities as jumping queues and engaging the services of a prostitute were rated similarly. One possible explanation is that most people have faced queue jumpers and remember the immediate and definitive negative consequence for them (a few minutes’ extra wait).
People feel jumping queues isn’t fair, not morally right and breaches established social norms.
Immanuel Kant’s deontology provides a suitable explanation for the case of prostitution. Prostitution reduces a human being to an instrument for achieving sexual climax with another person. It violates the principle of treating every person as an end in themselves rather than the means for achieving one’s objectives.
Interestingly, selling counterfeit products is illegal in many countries, including Hong Kong, but purchasing them was considered the most acceptable. There are positive consequences of purchasing counterfeit products for the purchasers (lower cost) and also for the producers and sellers (profit).
It also appears acceptable in Hong Kong as the practice is widespread. Those who purchase counterfeit goods are unlikely to feel guilty about the lost profits of luxury brands.

Cultural influences
Our findings also support the idea that morality varies from culture to culture. There are differences between the two groups of visitors we surveyed and the Hong Kong residents.
In comparison to Western tourists, mainland Chinese tourists think it’s more acceptable to purchase counterfeit products in Hong Kong, jump queues and lie about a child’s age to get discounts. Western tourists, on the other hand, find it relatively more acceptable to engage the services of a prostitute.
Both groups think public misbehaviour due to drunkenness is more acceptable than the Hong Kongers do. Overall, Hong Kong residents appear stricter in their morals than either group of tourists.
Western tourists were more likely to participate in all the scenarios on holidays than at home, except for drunken misbehaviour; they do that at home as well. Hong Kong residents are also more likely to engage in all activities on holidays than at home.
On the contrary, mainland Chinese visitors are more likely to engage in most of the scenarios at home than on holidays, engaging the services of a prostitute being the exception. It appears that Chinese tourists are aware of the bad publicity they have been getting recently , especially in Hong Kong.
The Chinese government has been distributing educational information and started to blacklist “uncivilised” tourists since 2015. Its aim is to minimise inappropriate behaviour overseas.
Chinese tourists are now more likely to behave more ethically to avoid being blacklisted and ensure their personal safety.
Moral of the story
What action we think is ethical appears to largely depend on the culture we are brought up in and live in. In other words, we do what we think is acceptable to people we know and in the place where we are.
Individual principles, inherent morality and perception of fairness may appear as stricter guides for what is morally acceptable. But appealing to the consequences and the risk of punishment seems more likely to deter people from engaging in morally dubious activities.
The idea that people are more likely to behave badly on holidays than at home, as some societal pressures are removed, appears plausible. But the case of Chinese tourists demonstrates that’s not always true.
Both punishing and educating tourists may be the best strategies for reducing unethical behaviour.
- Prostitution
- Immanuel Kant
- counterfeit goods
- Global perspectives
Audience Development Coordinator (fixed-term maternity cover)
Data and Reporting Analyst
Lecturer (Hindi-Urdu)
Director, Defence and Security
Opportunities with the new CIEHF
Click through the PLOS taxonomy to find articles in your field.
For more information about PLOS Subject Areas, click here .
Loading metrics
Open Access
Peer-reviewed
Research Article
Spatiotemporal behavior pattern differentiation and preference identification of tourists from the perspective of ecotourism destination based on the tourism digital footprint data
Roles Conceptualization, Investigation, Methodology, Writing – original draft
* E-mail: [email protected]
Affiliation Department of Environmental Design, School of Art and Media, Xi’an Technological University, Xi’an, China
Roles Conceptualization, Methodology, Software, Visualization, Writing – review & editing
Affiliation Department of Planning and Construction Research Institute, Northwest Branch of Beijing Tsinghua Tongheng Urban Planning & Design Institute, Beijing, China
Roles Formal analysis, Validation
Roles Validation
Roles Project administration, Supervision, Validation
Affiliation Department of Product Design, School of Art and Media, Xi’an Technological University, Xi’an, China
- Wei Dong,
- Qi Kang,
- Guangkui Wang,
- Bin Zhang,
- Published: April 28, 2023
- https://doi.org/10.1371/journal.pone.0285192
- Reader Comments
Tourist impact management in ecotourism destinations requires an accurate description of tourists’ spatiotemporal behavior patterns and recreation preferences to minimize the ecological environmental impact and maximize the recreation experience. This study classified tourist behaviors into five typical behavior patterns based on the digital footprints of tourists visiting Ziwuyu of the Qinling Mountains, including 348 traveling tracks and 750 corresponding geotagged photographs: short-distance, traversing, reentrant, large loop, and small loop. Furthermore, each behavior pattern’s recreation preference was identified using photograph analysis. Tourists with large-loop and reentrant behavior patterns have 89.8% and 30% chances of visiting Jianshanding, respectively. Key protected areas are faced with the risk of ecological environmental damage. Based on the behavior pattern differentiation and preference of tourists, this paper provides a decision-making basis for the classified management and guidance of tourists in ecotourism destinations. It has reference value for the management of similar ecotourism destinations.
Citation: Dong W, Kang Q, Wang G, Zhang B, Liu P (2023) Spatiotemporal behavior pattern differentiation and preference identification of tourists from the perspective of ecotourism destination based on the tourism digital footprint data. PLoS ONE 18(4): e0285192. https://doi.org/10.1371/journal.pone.0285192
Editor: Weili Duan, University of the Chinese Academy of Sciences, CHINA
Received: August 25, 2022; Accepted: April 18, 2023; Published: April 28, 2023
Copyright: © 2023 Dong et al. This is an open access article distributed under the terms of the Creative Commons Attribution License , which permits unrestricted use, distribution, and reproduction in any medium, provided the original author and source are credited.
Data Availability: The use of the dataset was done in compliance to the Foooooot and 2bulu Privacy Policy ( https://www.2bulu.com/about/terms_use.htm , https://image1-oss.v.lvye.com/cert/app-sixfoot-yonghuxieyi.html ), which stated that the anonymized and aggregated data could be used for other services. This study was carried out with the support of Foooooot and 2bulu, and the use of anonymized and aggregated data is authorized by Foooooot and 2bulu and its Terms and Conditions. In addition, the use of third-party data is also in compliance with the Plos one policies. However, some restrictions will apply when accessing the original data, and the data request should be addressed to Foooooot ( http://www.foooooot.com/ , E-mail: [email protected] ) and 2bulu ( https://www.2bulu.com/ , Email: [email protected] ).
Funding: This paper was supported by the National Social Science Foundation of China (grant number 21BXW017); the Scientific Research Program Funded by Shaanxi Provincial Education Department (grant number 20JK0192) and the Humanities and Social Science Project of Education Ministry (grant number 21YJA760064). The funders had no role in study design, data collection and analysis, decision to publish, or preparation of the manuscript.
Competing interests: The authors have declared that no competing interests exist.
Introduction
In the premise of “protecting natural resources of national parks, ecotourism destinations are committed to provide high-quality ecotourism services for tourists [ 1 ]. The key is to achieve a balance between human recreational activities and nature conservation [ 2 ]. Global continental ecotourism destinations witness approximately 8 billion tourist arrivals each year [ 3 ] (estimated in 2015), with an economic output of 6 trillion dollars [ 4 ] (estimated in 2019). Tourism activities in ecotourism destinations that are designed with the environment as the main attraction play an important role. However, frequent recreational activities have invariably had a negative impact on the ecological environment, such as plant trampling, a decrease in soil organic substances, the destruction of aquatic ecosystems, and the loss of wildlife habitat [ 5 , 6 ]. Therefore, effective tourist management is crucial for avoiding ecological risks, improving the recreation experience, and achieving the sustainable development of ecotourism [ 7 ].
Tourist impact management effectively solves the conflicting aims of tourism and environmental protection in ecotourism destinations [ 8 ]. The objective of tourist impact management is to achieve a dynamic balance between minimizing impact on resources and the environment and maximizing recreation experience quality at ecotourism destinations [ 9 ]. Limits of acceptable change (LAC), recreational opportunity spectrum (ROS), visitor activities management planning (VAMP), tourism optimization management model (TOMM), visitor experience and resource protection (VERP), visitor use management (VIM), and other modes of tourist impact management are currently in use [ 8 ]. Except for differences in specific operations, they have the same core idea: paying attention to the recreation experience quality of tourists and emphasizing the control of tourist impact while meeting the expectations of tourists. More flexible management measures shall be implemented according to the recreational process and characteristics of tourists [ 1 , 9 ]. Under the guidance of the aforementioned theories, studies have been conducted on tourists’ spatiotemporal behaviors with the goal of tourist impact management. These studies aimed to help identify tour routes, tour locations, and usage levels in key protected areas to provide “early warnings” of ecological risks in ecotourism destinations to minimize the impact of tourism activities on the ecological environment [ 10 ].
Most studies on tourist spatiotemporal behavior patterns in ecotourism destinations have mainly focused on the general description of the level of recreational use [ 11 ] but lack an in-depth analysis of the spatiotemporal behavior patterns of tourists and the characteristics of nonspatial tourists [ 12 ]. In particular, few studies have been conducted on tourist behavior patterns and their recreation preferences from the perspective of tourist impact management [ 13 ]. Stamberger L et al. demonstrated in a study on Denali National Park and Preserve that tourists exhibit different behavior patterns in recreational activities at ecotourism destinations, and identifying areas that may suffer environmental degradation under different patterns is critical to ensuring the effectiveness of tourist impact management [ 14 ]. Furthermore, a recent study by Väisänen T et al. found significant differences in recreation preferences among different tourist groups using geotagged photographs, emphasizing the importance of understanding tourist preferences in ecotourism destinations [ 15 ]. Given the above, it is unscientific and usually ineffective to guide tourist impact management with the research results not considering tourists’s behavior patterns and recreation preferences, which has been agreed by scholars such as Beeco JA et al. [ 1 ], Sisneros-Kidd AM et al. [ 16 ], and Wilkins EJ et al. [ 17 ].
The research objectives of this study are listed as follows: (1) guided by tourist impact management and based on the spatiotemporal factors such as visiting duration, route length, and visits to scenic spots, the typical spatiotemporal behavior patterns of tourists in ecotourism destinations were identified. The negative impacts of each pattern on key ecological reserves were evaluated. (2) Tourist recreation preferences were investigated under various patterns. Based on this, the recreation experience of tourists in each pattern was specifically optimized. Furthermore, alternative schemes for tourists entering key ecological reserves based on their recreation preferences were established, and guidance was provided through design strategies to achieve more scientific, effective, and humanized tourist impact management.
This paper is organized as follows: in the first section, the research progress of current tourist spatiotemporal behaviors is summarized from the aspects of data, methods, and applications. In the second section, the current situation of ecotourism in Ziwuyu, which is the research object, the acquisition and processing of tourists’ digital footprints, and the methods used in this study for identifying tourists’ behavior patterns and recreation preferences are discussed. The empirical research is presented in the third section, focusing on the differentiation of spatiotemporal behavior patterns of tourists in Ziwuyu; additionally, the differences in recreation preferences among different behavior patterns are detailed. This study’s summary, recommendations, discussion, and prospects are presented in the final section.
Research progress of tourists’ spatiotemporal behaviors
Digital footprints enabling the accurate description of tourists’ spatiotemporal behaviors.
After nearly half a century of development, the time-geography-centered research on spatiotemporal behaviors has become an important perspective for understanding the correlation between geographical space and human behaviors [ 18 ]. The development of surveys on spatiotemporal behaviors can be divided into four stages. The first stage mainly involved on-field behavioral observations and interviews to acquire information on the general behavior of tourists through careful observations. However, interviews are time-consuming, laborious, and limited in sample size and thus pose the risk of over-interpretation even though they can provide a deeper understanding [ 19 ]. The second stage involved using activity logs data to summarize the general spatiotemporal patterns of tourists. Mings RC, the representative scholar, summarized four typical behavior patterns through activity routes based on the activity logs of 600 tourists [ 20 ]. However, due to the over-reliance on memories and cognitive level of the respondents, surveys based on activity logs yield poor accuracy in the aspects of routes, behavior chain, and duration of stay [ 21 , 22 ].
With the development of GPS technology, positioning navigation, and timing function enabled high-accuracy and continuous information of location, speed, and time, enabling the accurate acquisition of the spatial position and state of tourists. The survey of tourists’ spatiotemporal behavior henceforth entered the third stage of development. Using GPS track data, Beeco JA et al. identified the potential recreation conflict areas of different tourist groups in urban parks [ 23 ]. Korpilo S et al. also used GPS track data to study the impact of the environment on tourist’ tour routes in complex road networks [ 24 ]. Taking ski tourism in Tatra National Park as an example, Bielański M et al. systematically explained how to use GPS track data to monitor tourist activities’ location, intensity, and duration in fragile environments [ 25 ]. Based on the GPS track data and questionnaire information of tourists in Hong Kong Ocean Park, Huang X et al. accurately described three types of spatiotemporal behavior patterns of tourists visiting Hong Kong [ 26 ]. The track data obtained using portable GPS devices have been widely used in tourist spatiotemporal behavior studies.
However, the self-collection of GPS track data is time-consuming and labor-intensive, and samples are usually limited to a specific season. Furthermore, tourists are more likely to change their routes consciously if they are aware that their spatiotemporal behaviors are being monitored. Tourists can leave electronic footprints along with positioning information on the network while traveling in the information age. Such digital footprints can paint a complex picture of tourists’ individual and group behaviors [ 27 ]. The fourth stage is the research on tourists’ spatiotemporal behaviors based on their digital footprints. American scholar Girardin F proposed the concept of digital footprint [ 28 ]. Compared with traditional sociological survey methods such as spatiotemporal diaries, brain cognitive maps, observational methods, questionnaires, and interviews, the digital footprint can record and describe the spatiotemporal behaviors of tourists more accurately. Compared with GPS location trackers, digital footprint requires less effort, can yield a larger sample size, and covers the four seasons. Thus, this data source has a better representation of tourists’ spatiotemporal behaviors.
In microscale studies on digital footprints, Wood SA et al. estimated the visiting behaviors of tourists at 836 scenic spots worldwide through the geo-referenced photographs and photographers’ information from Flickr, an online social media site. They compared the results with the experience data for these scenic spots. They found that digital footprint can be a reliable representation of empirical visitation rates [ 29 ]. Väisänen T et al. analyzed photographs captured by tourists visiting Finnish national parks using computer vision methods such as semantic clustering, scene classification, and object detection. They identified the recreation preferences of different tourist groups based on the photographs in digital footprints [ 15 ]. Liu Y obtained the jogging track data of citizens in urban parks from social media to analyze the spatiotemporal behavior patterns of jogging in urban parks and demonstrated through regression analysis that designated jogging tracks and aquatic installations in parks have a positive impact on jogging [ 30 ]. The preceding studies show that geographic reference and track data can be used to quantify tourist behavior characteristics across multiple dimensions. Such digital footprints are distinguished by their timeliness, universality, and authenticity, and they play an indispensable role in the study of tourists’ spatiotemporal behaviors. They are also becoming an important means of accurately describing tourists’ behaviors. However, few studies have successfully combined photograph and track data. Therefore, solving the problem of integrating multisource data in empirical research is critical.
Synchronous development of studies on behavior patterns and recreation preferences
The research on tourists’ spatiotemporal behaviors exhibits a trend of synchronous development between studies on behavior patterns and recreation preferences. In terms of behavior patterns, based on the spatial information of stay and the sequence information of visited places, Orellana D et al. proposed two methods for aggregating tourist behavior patterns: movement suspension patterns (MSPs) and generalized sequential patterns (GSPs) [ 31 ]. By introducing the research methods of time-geography into the study on tourist behaviors, Huang X et al. verified the feasibility of using time, spatial, and activity area information as the clustering elements of tourists’ spatiotemporal behavior patterns [ 26 ]. Kidd AM et al. extracted the start and end time of travel, place, and duration of stay, and other information from GPS tracks of tourists’ vehicles for cluster analysis and divided the behavior patterns of tourists visiting the Moose-Wilson corridor of Grand Teton National Park into three types: opportunistic commuters, wildlife/scenery viewers, and hikers [ 13 ].
With respect to the study on recreation preferences, the differences in the spatiotemporal distribution of tourists with different properties in scenic spots have been studied extensively. Taking Sarawak Malaysia Total Protected Area as an example, Abdurahman AZ et al. conducted spatial and temporal analyses of the monthly average trend of local and foreign tourists. They identified the months and places witnessing the maximum visits [ 32 ]. Huang Q et al. quantized the spatiotemporal distribution characteristics of recreational behaviors of backpackers with different travel modes in Beijing [ 33 ]. Furthermore, environmental factors influencing recreation preferences have been investigated to establish a link between tourist behavior and tourist destinations. For example, Van Vliet E et al. conducted an online selection experiment of virtual parks to investigate the impact of park environmental factors on tourists’ recreation preferences. They discovered that natural factors such as trees and flowers significantly impact tourists’ recreation preferences [ 34 ]. Veitch J et al. studied the environmental factors affecting the participation of older people in physical exercise and social activities in parks. They found that tree-shaded areas and quiet trails are more important to them [ 35 ].
The research on tourist behavior patterns has mainly focused on the similarity of tourist spatiotemporal behaviors. Based on this, structured classification has been conducted to improve scenic area management. The study of tourists’ recreation preferences focuses on the differences in the tourists’ spatiotemporal behaviors and the optimization of tourists’ recreation experiences by identifying different preferences. However, the common purpose of these two types of studies is to describe tourists’ behaviors in scenic area. The current study investigated the dilemma of tourist management in ecotourism destinations in combination with these two modes of thinking.
Considering the subject and object in the research on tourist spatiotemporal behaviors
The application of tourists’ spatiotemporal behavior research can be summarized into two categories: (1) focusing on the recreation experience optimization of the recreation subject and (2) focusing on scenic area management. In terms of the recreation experience optimization, Huang X et al. proposed that tourist destinations should control the tourist flow according to different patterns, reduce waiting time at venues and facilities, and provide targeted services to improve the quality of the tourist experience. To this end, they studied the spatiotemporal behavior pattern of tourists in Hong Kong Ocean Park [ 26 ]. Taking tourist groups as the research object and through the quantitative analysis of their spatiotemporal behavior characteristics, Zhao X et al. proposed measures such as improving the travel route design of the group and adding small commercial spots to improve the travel experience of tourist groups [ 36 ]. Xia JC et al. considered tourists visiting Phillip Island, Victoria, Australia, as an example, and divided the tourism market segments by identifying several important mobility patterns. This helped park managers decide when to open scenic spots and how to arrange the daily activities at scenic spots to meet the needs of tourists and improve their experience [ 37 ].
Stamberger L et al. determined the areas that might suffer from environmental degradation by studying the spatiotemporal behavior patterns of tourists in remote areas for the research on tourists’ spatiotemporal behaviors to support scenic area management, using Denali National Park and Preserve as an example. They demonstrated the practical significance of studying tourists’ spatiotemporal behaviors in ecotourism destinations for tourist impact management [ 14 ]. To minimize the impact of tourists on the ecological environment, Kidd AM et al. analyzed the spatial behavior patterns of tourists traveling by bus in Grand Teton National Park and analyzed the classified benchmark management of tourists in ecotourism destinations [ 13 ]. D’Antonio A et al. used GPS tracking to study the spatial behavior of tourists in three parks. It was reported that understanding the spatiotemporal behavior characteristics of tourists is of great significance for protecting ecological environments such as national parks and improving the tourist experience [ 38 ].
From the above discussions, it is obvious that the application of tourist behavior research presents a binary differentiation. Some researchers focused on studying tourist behavior to improve the recreation experience, whereas some aimed to guide the tourist management of national parks by analyzing tourists’ spatiotemporal behaviors. However, according to tourist impact management theory, good coordination between environmental protection and recreation experience is required for ecotourism destinations. Thus, this study aimed to reduce the impact of ecotourism destinations on the environment and resources while increasing the quality of the recreation experience by revealing the differentiation of tourists’ spatiotemporal behavior patterns and preferences. Additionally, Ziwuyu in the Qinling Mountains was chosen to conduct empirical research.
Behavior research design under tourist impact management
Current tourist impact management of wuziyu, qinling mountains.
The Qinling Mountains, together with the Alps in Europe and the Rocky Mountains in North America, are crowned as the “three mountains” of the world. The Qinling Mountains act as the dividing line between the north and south climate in China, constitute an important ecological safety barrier and water conservation area, and is one of the regions with the richest biodiversity in the world. The Shaanxi section of the Qinling Mountains has an average annual CO2 absorption of 146.7 million tons (statistical data collected in 2021) [ 39 ], which is significant in coping with global climate change. The Qinling Mountains are characterized by uniqueness, complexity, and ecological sensitivity. With the continuous increase in the regional population, resource development, and urbanization, the Qinling Mountains are facing increasingly severe environmental stress, and the contradiction between social development and ecological environment protection is becoming increasingly prominent. The Qinling Mountains are connected with the plains through 72 valleys. The valley’s mouth-shaped area is endowed with unique natural characteristics, rich culture and historical resources, and a complete ecosystem. As a hub connecting protected and nonprotected areas, it is also the area where the conflict between development and protection is most prominent.
Ziwuyu is an important area with heritage sites, recreational resources, and ecological buffer zones located in the transitional zone of the mountain and plain ecosystems. Ziwuyu was chosen as the research object in this study to investigate the tourist impact management of ecotourism destinations. On the one hand, Ziwuyu, a typical ecotourism destination popular with tourists, can meet various recreational needs such as being close to nature, cultural education, mountaineering expeditions, and local experiences. Ziwuyu, one of the 72 valleys of the Qinling Mountains and the birthplace of Taoism, is located in Chang’an District, Xi’an City, with 108.89 degrees east longitude and 34.03 degrees north latitude, a length of 7.44 kilometers, and an area of 17.53 km 2 . Ziwuyu is an important cultural heritage-bearing area, recreational resource gathering area, and ecological buffer zone located at the ecotone of the mountain and plain ecosystems. Therefore, conducting research on tourist impact management in ecotourism destinations with Ziwuyu as the object is appropriate. On the one hand, as a typical ecotourism destination popular with tourists, Ziwuyu has numerous cultural and historical relics, such as Jinxian Temple, Cliff Stone Carvings, and Xuandu Temple, as well as over 200 types of precious medicinal materials such as Poria cocos, Gastrodia elata, and Ganoderma lucidum. Ziwuyu, with its lush peaks, beautiful scenery, dangerous terrain, and ancient trees, can accommodate a wide range of recreational needs, including getting close to nature, cultural education, mountaineering exploration, and local experience. Ziwu Valley is 29.70 km from downtown and can be reached in one hour by car. It is the valley in the Qingling Mountains closest to downtown. Previously, it could receive 80,000 to 100,000 tourists on the weekend during peak season. n the other hand, Ziwuyu is faced with urgent ecological protection. In 2019, Xi’an Qinling Mountains Ecological and Environmental Protection Regulations (“Regulations”) were issued, and the Qinling Mountains Ecological Protection Station was set up in Ziwuyu, limiting the daily count of tourists entering the valley to no more than 3000. In addition, numerous rigid control measures were implemented. As an ecotourism destination, the contradiction between recreational activities and ecological protection in Ziwuyu has become prominent.
Ziwuyu receives tourists with different tour motivations, recreational behaviors, and local villagers. Thus, taking Ziwuyu as a research object, it is typical to study the differentiation of tourist behavior patterns and their recognition of recreational references from the perspective of tourist impact management in ecotourism destinations. The terrain in Ziwuyu is higher in the south than in the north, and the valley mouth is on the northernmost side, at an elevation of about 500 m. Jianshanding, located in the valley’s southeast corner, has an elevation of 1584 m and is a protected area as defined by the regulations. According to the requirements, measures should be implemented to prevent the entry of people who are unrelated to environmental protection. In Ziwu Valley, the terrain is high in the south and low in the north. Yukou is located on the valley’s northernmost ridge at an elevation of about 500 m. According to the local tourist impact management policy, the elevation of the peak at the southeast corner of the valley reaches 1584 m. It thus belongs to the key protection area specified in the Regulations, which primarily performs the ecological protection function. Closed measures should be implemented to limit human activities to the greatest extent possible and to prohibit the entry of personnel unrelated to environmental protection, following the requirements. Such rigid constraints can help achieve tourist impact management but will also inevitably diminish the recreation experience of tourists and villagers. However, the control of the tourist count cannot eliminate the risk of environmental damage due to the ignorance of the differentiation of tourists’ spatiotemporal behavior patterns. Therefore, this study developed a method to identify behavior differentiation and preferences to support more flexible and effective tourist management in ecotourism destinations.
Acquisition and processing of tourist digital footprints
Tourism digital footprint includes GPS tracks, location photographs, travel logs, and online reviews, with a collection time span of several years. It offers the advantages of accurate positioning, rich behavior information, low cost, and a large sample size [ 40 ], enabling better control of the heterogeneity of individual recreational behavior [ 41 ]. Its effectiveness in the study of tourists’ spatiotemporal behaviors has been verified [ 42 ]. However, the digital footprint has certain shortcomings when applied to behavioral research, such as changes in data accessibility, exclusion of non-user individuals, and insufficient user attributes [ 43 ]. Thus, its reliability should be carefully considered when using it for research [ 44 ]. These are not insurmountable obstacles. The integration of data from different platforms can help increase the representativeness of samples and enable better evaluation of the heterogeneity preference of tourists in ecotourism destinations [ 45 ]. In addition, appropriate data cleaning can improve the robustness of the study [ 10 ].
Taking the tourism digital footprints from http://www.foooooot.com/and https://www.2bulu.com/ , the two popular Internet track-sharing platforms widely used by Chinese people, as the data source. According to the privacy policies of the two platforms, users have authorized the two platforms to collect information such as personal information, activity track, and photos, as well as to use anonymized and aggregated data. Yao Q et al. and Zhang H et al. demonstrated the reliability of the two data sources in the study of tourist behavior [ 46 , 47 ]. With the support of Foooooot and 2bulu, we obtained the tourism digital footprint of Ziwuyu for March 2017-March 2020, including 482 anonymous tourist tracks and 2558 geotagged photographs ( Fig 1 ). All tourists are anonymous because this is a retrospective study of archived samples. Before we could access the data, it was completely anonymized. The ethics committee of Xi’an Technological University waived the requirement for informed consent, and the committee approved the study. A preliminary cleaning was performed on the collected track data to improve the reliability of the data for subsequent analysis. We deleted the samples that did not pass through the study area, the samples whose tracks were incomplete, and the samples wherein the positioning points were vague, and the recreational route could not be identified accurately. Furthermore, samples with a tour duration of less than 30 min and a route distance of less than 1.5 km were removed. Following cleaning, 348 effective tracks with an effective rate of 73% and 321,208 data-positioning points were obtained for analysis. Each point had the following attributes: track number, serial number, track point longitude, and latitude, the distance between two points, and timestamp. On this, the photograph data of the track were also cleaned. After deleting the samples with very low resolution, blurry images, too complex content, and unclear subjects, a total of 1792 effective photographs were obtained for the subsequent identification of the recreation preferences of tourists in Ziwuyu.
- PPT PowerPoint slide
- PNG larger image
- TIFF original image
Reprinted from [ https://www.usgs.gov/centers/eros/data ] under a CC BY license, with permission from [United States Geological Survey], original copyright [2000]. Reprinted from [ https://www.2bulu.com/ ] under a CC BY license, with permission from [Shenzhen Bubulu Information Technology Co., Ltd.], original copyright [2020].
https://doi.org/10.1371/journal.pone.0285192.g001
Behavioral research method based on digital footprint
Identification of tourist behavior pattern.
Touring duration and locations are the key and active variables causing environmental destruction in ecotourism destinations and are also the key attributes for identifying tourist behavior patterns. To identify the pattern differentiation, we first extracted the spatiotemporal information contained in digital footprints. A variety of behavior tracks of tourists visiting Ziwuyu were clustered into several typical behavior patterns according to their spatiotemporal attributes in the ecotourism destination. Because there were both categorical and continuous variables in the cluster elements, the TwoStep Cluster in SPSS25.0 software was used to structurally classify the recreational spatiotemporal behaviors of tourists visiting Ziwuyu. The specific steps were as follows:
Step 1: The collected track data of tourists visiting the study area were inputted into the ArcGIS software. The track was expressed as a group of continuous spatial positioning points attached with coordinates, time, elevation, and other information.
Step 2: According to theories about tourists’ spatiotemporal behaviors, the cluster elements were divided into temporal and spatial elements. The time tourists entered and exited the study area and the time spent in recreation were all considered temporal elements. The number of visits to 30 scenic spots, the number of scenic spots visited, and the length of the tour route were all spatial elements. All of these were considered to be the initial cluster elements. Some scenic spots affecting the cluster were removed according to the stops of tourists (<5%) and the significance of cluster (≥0.05).
Step 4: The nodes were classified based on the CF classification tree. The optimal cluster number was determined based on the BIC value of the Bayesian information discrimination formula and the changes in the shortest distance between clusters. Five typical spatiotemporal behavior patterns of tourists in Ziwuyu were finally obtained.
Identification of tourists’ recreation preferences
Travel photographs are an important part of tourists’ tourism activities. This study adopted photograph analysis to quantitatively analyze tourists’ recreation preferences [ 48 ]. A total of 1792 tourist photographs were classified into five groups based on cluster analysis results. The number of users in each group was not equal to the number of photographs uploaded by each user. Given the complexity of photograph content and the sensitivity of the research method, and to avoid the interference of active users on research results [ 49 ], random sampling was conducted to improve the reliability of research results. The approach was: based on the number of tourist samples of each typical behavior pattern. Given that some users had not uploaded photographs, 30 tourists were chosen randomly as the initial samples for each pattern. After that, five photographs were chosen at random from the photographs uploaded by each user for further analysis. If a user uploaded fewer than five photographs, the photographs were drawn at random from other users with the same behavior pattern based on the difference. Finally, 750 sample photographs were obtained to identify tourist recreation preferences under typical behavior patterns.
First, the 750 sample photographs were coded freely using the NVivo 10 software to interpret the content of the photographs. No more than four free nodes were selected for each photograph. Due to the various categories of free coding, the internal differences and connections among them were determined. In accordance with the content characteristics, the node categories were determined to complete the axis coding, and the differences among categories were analyzed. For instance, forests, shrubs, streams, and flowers belong to the category of the natural landscape. In contrast, temples, Taoist temples, door plaques, memorial gates, and scriptures belong to the category of historic culture. A total of four first-level codes were obtained: natural landscape, historic culture, native village, and mountaineering expedition. The frequency statistics of each free node and subtree node were exported using the statistical function of NVivo 10 to quantize tourists’ recreation preferences under different patterns. The reliability of the photograph codes was assessed after the completion of coding. In this study, 1667 nodes were coded in the first round, among which 34 nodes were modified and deleted during the second round of coding. A total of 1630 nodes were finally coded, with an agreement degree of 97%, indicating that the coding performed in this study yields high stability and reliability [ 50 ]. It is thus feasible to conduct further result analysis.
Identification of tourist spatiotemporal behavior patterns and recreation preferences
Overall characteristics of tourists’ spatiotemporal distribution.
From the overview of the sample ( Table 1 ), men accounted for 72%, of the tourists visiting Ziwuyu, much higher than that of women. The proportion of elderly, middle-aged, and young people was 76%, 16%, and 8%, respectively, indicating that elderly tourists are the main visitors to Ziwuyu. Regarding temporal distribution characteristics, 34% of tourists chose to travel in autumn, 26% in winter, 24% in spring, and 16% in summer. In terms of the tour duration, 55% of tourists toured for 4–8 h, and 34% of tourists visited for less than 4 h. Furthermore, 38 tourists visited for more than 8 h, accounting for 11% of the sample.
https://doi.org/10.1371/journal.pone.0285192.t001
Concerning spatial distribution characteristics, 59% of tourists had a tour route of 8–16 km, 18% of tourists had a route of over 16 km, and 17% and 5% of the tourists had tour routes of 4–8 km and less than 4 km, respectively. Concerning the number of scenic spots visited, 30%, 25%, and 27% of tourists visited 5–7, 8–10, and more than ten scenic spots, respectively. Only 18% of tourists visited 2–4 scenic spots. Autumn was discovered to be the peak season for Ziwuyu, and the majority of tourists were elderly men; most of them chose a tour route of 8–16 km, with an average speed of less than 3 km/h, and visiting 5–7 nodes.
Five typical spatiotemporal behavior patterns of tourists
According to the cluster analysis results ( Table 2 ), the tourist behaviors of those visiting Ziwuyu were structured into five typical spatiotemporal behavior patterns with a proportion of 18.8%, 22.8%, 26.0%, 18.2%, and 14.2%, indicating a good cluster effect. The analysis of the clustering results from temporal and spatial characteristics revealed significant differences in the length of tour routes, number of scenic spots visited, and total number of tourist visits under the five patterns. The five spatiotemporal behavior patterns were named after the above information: short-distance, traversing, loop, large-loop, and small-loop. Each behavior pattern is explained in greater detail in the following text.
https://doi.org/10.1371/journal.pone.0285192.t002
Pattern 1: Short-distance.
Tourists in this pattern had the shortest tour duration of approximately 3.5 h and the shortest route length of 5.8 km. As shown in the diagram of linear density analysis, such tourists were characterized by relatively dispersed tour routes and less scenic spots visited, mainly within 3 km from the entrance of the valley. The main nodes visited were the entrance, Guaierliang, and Xiliang, and the tourists left the study area from Xiliang ( Fig 2 ).
Reprinted from [ https://www.usgs.gov/centers/eros/data ] under a CC BY license, with permission from [United States Geological Survey], original copyright [2000].
https://doi.org/10.1371/journal.pone.0285192.g002
Pattern 2: Traversing.
Tourists in this pattern had a relatively short tour duration of approximately 4 h, but the route length was 10.1 km. According to the tour route ( Fig 3 ), after entering from the entrance, tourists in this pattern passed through the nodes, including Guaierya, Jinxian Temple, Xiliang, and Qiliping, and then arrived at Tudiliang, from where the route started to disperse. They left the study area from the non-entrance.
https://doi.org/10.1371/journal.pone.0285192.g003
Pattern 3: Reentrant.
Tourists in this pattern visited for approximately 6 h. As shown in the diagram of linear density analysis ( Fig 4 ), such tourists were characterized by relatively dispersed tour routes. The main route was to enter the mountain from the valley mouth and reach Tudiliang through Guaierya and Jinxian Temple. Due to physical constraints, it was impossible to complete the large loop; thus, tourists returned to the valley mouth using the same route or part of the same route.
https://doi.org/10.1371/journal.pone.0285192.g004
Pattern 4: Large loop.
The duration of the tour was approximately 7.5 h, the longest tour route was approximately 17 km, and the number of scenic spots visited was up to 14. This pattern has high physical requirements for tourists. As shown in the diagram of linear density analysis ( Fig 5 ), the main route of tourists in this pattern was to start from the entrance, pass through Guaierya, Jinxian Temple, Qiliping, Shili farmhouse restaurant, Yuandengtai, Dayangjiao and Xiaoyangjiao, Jianshanding, Zuobiyuyakou, Sidaoliang, Erdaoliang, Yuandengtai, and Xiaowutai, and finally scattering into two routes to go down the mountain.
https://doi.org/10.1371/journal.pone.0285192.g005
Pattern 5: Small loop.
According to the cluster analysis results, tourists in this pattern accounted for 18.2% of the total tourists. Tourists in this pattern had a tour duration of 6 h and 15 min and a tour length of approximately 14 km, and the number of scenic spots visited was 10. The main route was to start from the entrance, pass through Guaierya, Jinxian Temple, Qiliping, Quanzhen Temple, Zuobiyuyakou, Sidaoliang, Erdaoliang, Yuandengtai, and Xiaowutai, and return to Guaierya to leave ( Fig 6 ).
https://doi.org/10.1371/journal.pone.0285192.g006
Tourists’ recreation preferences and visit probability
To further understand tourists’ recreation preferences of different behavior patterns, further investigation was conducted using photograph analysis. The results ( Table 3 ) revealed that forests, mountain roads, temples, and farmhouses, respectively, accounted for the largest shares in the four subtree nodes. According to the findings, tourists who are interested in natural landscapes are more likely to visit forests to take photographs. Tourists interested in mountaineering expeditions paid special attention to the rugged mountain roads. Temples and farmhouses drew the most attention from tourists interested in experiencing historic culture and native villages, respectively. Among the four first-level codes, natural landscape witnessed the maximum number of visits (57.55%), followed by mountaineering expeditions (25.46%) historic culture (11.60%), and native villages (5.40%). The statistical results revealed that tourists visiting Ziwuyu were mainly passionate about natural landscapes and mountaineering expeditions, supplemented by the experience of historic cultures and native villages.
https://doi.org/10.1371/journal.pone.0285192.t003
Theoretically, tourists visiting Ziwuyu have 15 recreation preferences, including four single and 11 mixed preferences. However, according to the actual results ( Fig 7 ), there are five types of recreation preferences of tourists visiting Ziwuyu, of which two are single preferences, namely native villages and mountaineering expeditions, two are mixed preferences of two categories, namely natural landscape–historic culture and historic culture–mountaineering expedition, and one is a mixed preference of three categories, namely natural landscape–native village–mountaineering expedition. The recreation preference of each typical spatiotemporal behavior pattern is further explained here, and the probability of tourists visiting scenic spots was calculated through cross chi-square analysis to identify the risks of recreational behavior on the ecological environment of Ziwuyu.
https://doi.org/10.1371/journal.pone.0285192.g007
Short-distance spatiotemporal behavior pattern: Tourists who exhibit this pattern have a strong leisurely nature. Tourists preferred "Natural landscape-historic Culture" for recreation, indicating that tourists in this pattern considered Ziwuyu a daily sightseeing and leisure destination. The probability of tourists in this pattern visiting Guaierya and Xiliang was 56.9% and 58.5%, respectively, and the probability of leaving the study area was 75.4%, as indicated by cross chi-square analysis. In addition, some tourists also visited Jinxian Temple, Xiaowutai, North Dongliang, and Yuandengtai, with a visiting probability of 41.5%, 26.2%, 13.8%, and 10.7%, respectively. In this pattern, tourists were concentrated in the north of the valley mouth, with less activity duration and small activity space, thereby having less impact on the environment.
Transversing spatiotemporal behavior pattern: The tourist recreation preference in this pattern was “native villages.” Cross chi-square analysis revealed that the probability of tourists visiting Qiliping in this pattern was 100%; thus, it was speculated that most of these tourists are local villagers, and Qiliping is the only way they have to pass during daily going out. After passing Tudiliang, the routes of many tourists started to disperse rapidly, with approximately 82.3% probability of leaving the study area by different routes. Among them, 50.6% of the tourists passed westward through Banliyakou to Cuibei Mountain to leave. In terms of the direction of travel, tourists in this pattern mostly passed through the valley mouth to arrive at Huangyu Temple, which is 1.3 km away from the west side of Banliyakou, or entered Fengyu.
Reentrant spatiotemporal behavior pattern: Tourists in this pattern exhibited the most comprehensive recreation preference, which can be summarized as “natural landscape-native villages-mountaineering expedition.” Cross chi-square analysis revealed that some tourists in this pattern did not turn back completely; instead, they visited Dayangjiao, Xiaoyangjiao, and Quanzhen Temple, with a visit probability of 33.3%, 32.2%, and 26.7%, respectively. Tourists in this pattern exhibited a 30% probability of visiting Jianshanding, a key protected area stipulated in the Regulations. Thus, Jianshanding may be faced with potential negative impacts from tourists.
Large-loop spatiotemporal behavior pattern: The recreation preference of tourists in this pattern was “historic culture-mountaineering expedition.” Cross chi-square analysis revealed that the probability of tourists visiting Yuandengtai and Xiaowutai in this pattern was 100%, which is consistent with the results of the photograph analysis. The probability of tourists visiting South and North Dongliang was 38.8%, indicating that the proportion of people passing down the mountain via these two routes is comparable. In addition, a few tourists exited the mountain from the east side of Dongliang. The probability of tourists visiting Jianshanding in this pattern was found to be up to 89.8%, indicating that this is the most dangerous spatiotemporal behavior pattern for Ziwuyu. Therefore, appropriate controls, and guidance measures should be implemented based on the behavioral characteristics and recreation preferences of tourists.
Small-loop spatiotemporal behavior pattern: The recreation preference of tourists in this pattern was the “mountaineering expedition.” Cross chi-square analysis revealed that the probability of tourists visiting and consuming in Shili farmhouse restaurant was 27%. The probability of visiting Guaierya twice was 52.4%, indicating that it is an important node. Some tourists did not go through Guaierya and directly left from the valley mouth on the east side of Dongliang.
Conclusions and discussions
Application of tourism digital footprint in tourist impact management.
Tourism digital footprint has often been used to study the characteristics of tourist spatial flow at the macro scale of cities [ 51 ]; however, its role in tourist impact management in ecotourism destinations has been neglected [ 10 ]. Based on the digital footprints of tourists visiting Ziwuyu, in this study, the specific path was explored to differentiate tourists’ spatiotemporal behavior patterns and identify their preferences from the perspective of tourist impact management in ecotourism destinations; in addition, the reliability of using tourism digital footprint for studying tourist impact management in ecotourism destinations was verified. Tourist impact management in ecotourism destinations seeks a balance between minimizing impact on resources and the environment and optimizing recreation experience quality. Using tourism digital footprints to study tourists’ spatiotemporal behavior patterns and recreation preferences can lead to the development of more flexible tourist management policies for ecotourism destinations.
Tourism digital footprint can provide high accuracy across time, and large quantities of tourist behavior track data, which can be used for analyzing tourist spatiotemporal behavior patterns in ecotourism destinations. Through the cluster analysis of spatiotemporal elements such as tour duration, route length, and the number of scenic spots visited in this study, the tourist behaviors of those visiting Ziwuyu were structured into five typical behavior patterns: short distance, transversing, reentrant, large loop, and small loop. Compared with the traditional behavior observation method, activity log, and questionnaire method, the research results on tourist behavior patterns through tourism digital footprints are more objective. Compared with GPS track surveys, tourism digital footprint provides more accurate information by avoiding tourists deliberately changing their behavior when being tracked. Geotagged photographs constitute an important part of tourism digital footprint. The recreation preferences of tourists in ecotourism destinations can be identified by analyzing the photograph content. In this study, the recreation preferences of tourists in Ziwuyu were summarized into “natural landscape,” “historic culture,” “native village,” and “mountaineering expedition,” as well as 15 theoretical patterns of their various combinations. By describing the actual recreation preferences of tourists visiting Ziwuyu as the five typical behavior patterns, we successfully established a correlation between tourists’ behavior patterns and recreation preferences. This correlation is of great significance for tourist impact management in ecotourism destinations because it can guide in optimizing the recreation experience of tourists with different behavior patterns and provide guidance and control through the design of management strategies to minimize the impact of tourists on resources and the environment. In summary, it can provide technical support for improved management of ecotourism destinations.
Study of tourist behavior and minimization of impact on resources and environment
Accurately describing behavior patterns and recreation preferences of tourists in ecotourism destinations enables identifying the risks faced by the key protected areas in advance to minimize the impact of recreational behaviors on resources and the environment [ 14 ]. With a visiting probability of 89.8% and 30%, respectively, some tourists in the large-loop and reentrant behavior patterns had visited Jianshanding, the key protected area in Ziwuyu. There were significant differences in the behavior tracks of tourists in the key protected area. They preferred "historic culture-mountaineering expedition" and "natural landscape-native village-mountaineering expedition" for recreation. Therefore, the key protected area is at risk of ecological destruction. The study discovered that 63 people visited Jianshanding, the key protected area of Ziwuyu I, out of the 348 samples used, with an overall visit probability of 18.10% and an average duration of stay of about 30 min per person. In terms of the intensity of tourist activities in different behavior patterns, some tourists visited key protected areas in both the large-loop and reentrant behavior patterns, with visit probabilities of 89.8% and 30%, respectively. There are clear differences in their behavior tracks within the key protected areas. Their preferred recreational activities are "historic culture—mountaineering expedition" and "natural landscape—native villages—mountaineering expedition" with "mountaineering expedition" being the most common. Tourist trampling may harm Jianshanding’s surface vegetation, wildlife habitat, water resources, and soil. Therefore, the key protected area faces the risk of ecological environmental damage. Although the tourists in the small-loop behavior pattern did not visit Jianshanding, their recreation preference was “mountaineering expedition,” which should also be focused upon.
In this regard, in the scenic planning of Ziwuyu, the road from Tudiliang to Cuibei Mountain shall be kept open, and the node design and service facilities in Cuibei Mountain shall be reinforced. As a general protected area with an altitude of 1471 m, Cuibei Mountain meets the basic conditions to replace Jianshanding to meet the mountaineering needs of tourists. Historic cultural landscapes must be constructed along the path from Tudiliang to Jianshanding to weaken the attributes of mountaineering, and signage must be installed at Tudiliang to divert tourists on mountaineering expeditions to Cuibei Mountain, and necessary control measures must be implemented. With the aid of digital footprint, we revealed the differentiation of spatiotemporal behavior patterns and preferences of tourists in ecotourism destinations to support the humanistic transformation of ecotourism destination management. In other words, tourists should be considered the subject of activity, transforming from the control of only tourists to finding alternative solutions in combination with environmental carrying capacity and tourists’ recreation preferences. Furthermore, appropriate guidance and control measures should be adopted through design strategies to achieve a balance between the sustainable development of ecotourism destinations and the recreation experience of tourists, which is also the core goal of tourist impact management [ 52 ]. We found that many tourists visiting Ziwuyu choose to leave the study area from the non-entrance, and they may have visited other key ecological reserves. Thus, the scope of research must be expanded in future studies, deeming the various valleys in the northern foothills of Qingling Mountains as a whole to identify the behavior patterns and recreation preferences of tourists between and in valleys and the negative effects they may bring to the key protected areas must be evaluated more accurately.
Study of tourist behavior and maximization of recreation experience quality
The research results of behavior patterns and recreation preferences of tourists reported herein can guide tourist destinations to improve the design and layout of the facilities, which is of great significance to the optimization of tourists’ recreation experience in ecotourism destinations [ 45 ]. Through the cluster analysis performed in this study, the tourist behaviors of those visiting Ziwuyu were summarized into five typical behavior patterns. In addition, the recreation preference of tourists in each pattern was accurately identified through photograph analysis. In the transversing behavior pattern, tourists preferred native villages for recreation, and their probability of visiting Qiliping was 100%; however, their recreational activities can have a negative impact on the lives of local villagers. Therefore, tourist destinations should use the transversing tour route as a model for developing effective management strategies to guide and control tourism activities. The tourists’ recreational preference for traversing behavior pattern is "native villages" with the possibility of visiting Qiliping Village of 100%. Therefore, their recreational activities may have an impact on the spatial environment of local villagers, such as the potential negative impact of road congestion caused by tourists taking photos and the degradation of the quality of residents’ living environment caused by littering. It is recommended that the scenic spot use the traversing pattern’s travel path as a reference to develop effective management strategies to provide guidance or control. Tourists in the small-loop behavior pattern exhibited a 27% probability of visiting Shili farmhouse restaurant. Thus, dining facilities must be arranged according to the recreational characteristics of the small-loop pattern. In addition, more than half of the tourists in this pattern visited Guaierya twice, indicating that it is one of the important nodes. Thus, the construction of important nodes such as Guaierya must be emphasized, and corresponding service facilities must be established around them. Furthermore, we discovered that few tourists visit Quanzhen Temple, and both short-distance and large-loop behavior patterns have recreation preferences that include "historic culture." To improve the overall tourism value of Ziwuyu, corresponding design strategies must be adopted to enhance the spatial vitality of nodes such as Quanzhen Temple, and a "historic culture" tourism route must be created in combination with the recreational characteristics of tourists, running through Quanzhen Temple, Jinxian Temple, Xiaowutai, and Yuandengtai. Furthermore, we discovered that "historic and cultural" elements are present in tourist recreational preferences in short-distance and large-loop behavior patterns. It is suggested that the scenic spot combine tourist recreational characteristics to create a "historic cultural" Ziwuyu traveling route, connecting Jianshanding, Xiaowutai, Yuandengtai, and other tourist attractions characterized by religious culture, to increase Ziwuyu’s overall tourism value. The aforementioned findings demonstrate that tourist behavior research based on tourism digital footprint can aid in organizing and optimizing the spatial structure of ecotourism destinations, coordinating the behavioral conflict between tourists and local residents, guiding tour route design and tourism product supply, and serve as the basis for the collocation optimization of public service and commercial facilities [ 53 ], which are of great value for the maximization of tourists’ recreation experience.
Research deficiencies and future research
For tourist impact management in ecotourism destinations, in this study, we proposed a method to differentiate spatiotemporal behavior patterns and recreation preferences of tourists and conducted empirical research by taking Ziwuyu as the research object and using the tourist tracks and photographs as the digital footprint. The research findings presented in this paper will serve as a reference to guide the refined management of ecotourism destinations. First, as a single data source, specific groups can be screened out using the digital footprint [ 17 ]. Furthermore, there is a scarcity of information on tourist attributes obtained from the Internet, limiting extensive research on causal relationship identification and tourist attribute differentiation. Future studies should use multisource data to accurately describe the behavioral characteristics of tourists in ecotourism destinations. Second, the number of tourists visiting ecotourism destinations during the holidays differs greatly from that during normal times; thus, different response plans for tourist impact management should be developed. In the short term, the ideas and methods proposed in this study are also applicable to identifying behavior patterns and recreation preferences. In the future, digital footprints could be used to study holiday tourist behavior in ecotourism destinations. In addition, the similarities and differences between the short-term and long-term characteristics of tourists’ recreational behaviors must be studied [ 46 ] to improve the management system of ecotourism destinations. Third, a recent study by Frey E et al. provided empirical evidence that tourists’ tour motivation may affect their spatial behaviors [ 54 ]. By determining the correlation between tour motivation and tourists’ behavior patterns and their recreation preferences, the management department of ecotourism destinations can adopt measures to provide tourists with opportunities to realize their tour motivation while reducing the ecological impact [ 16 ]. Tour motivation should be fully considered in future studies on recreational behaviors for tourist impact management. Fourth, we worked on this paper for three years, including 40 days during the COVID epidemic. The corresponding sample size is only 0.57%. It is difficult to compare the characteristics of tourist behavior with the epidemic as the time node. In the future, the potential impact of epidemic factors on tourist spatiotemporal behavior and preferences should be fully considered. Finally, some researchers have begun focusing on the study of tourist behavior prediction by using the Markov model [ 55 ], heuristic prediction algorithm (HPA) [ 56 ], long short-term memory (LSTM)-based deep learning model [ 57 ], and other methods to predict the mobility of tourists, which is of great value to tourist impact management. However, few such studies have been conducted on ecotourism destinations and should be the focus in the future.
Acknowledgments
This manuscript has been proofread by Medgy.
- View Article
- Google Scholar
- PubMed/NCBI
- 9. Eagles PF, McCool SF. Tourism in national parks and protected areas: Planning and management. UK: CABI Publishing; 2002.
- Managing Tourist Behavior
- Management Strategies
- Adaptive Management
- Measuring Effectiveness
- Effective MPA Management
- Representation and Replication
- Critical Areas
- Connectivity
- Socioeconomic Criteria
- Marine Conservation Agreements
- Coral Bleaching
- Ocean Acidification
- Tropical Storms
- Protecting Herbivores
- Temporary Closures
- Land-based Impacts
- Recreational Use
- Invasive Species
- Coral Predators
- Stony Coral Tissue Loss Disease
- Models to Manage Tourism
- Diversifying Livelihoods
- Managing Social Resilience
- Restoration Introduction
- Sustainable Financing
- Coral Nurseries
- Larval-based Coral Propagation
- Outplanting
- Reef Substrate
- Rapid Response & Emergency Restoration
- Mangrove and Seagrass Restoration
- Aquaculture Status
- Aquaculture Production Cycles
- Shellfish & Seaweed
- Sea Cucumber
- Wild Stocks
- Water Quality
- Disease and Species Health
- Environmental Impact Assessments
- Area Management Approaches
- Community Planning
- Importance of Reef Fisheries
- Reef Fisheries Status
- Resilience of Fisheries
- Stock Assessment Methods
- Fishery Management Tools
- Fisheries Surveillance and Enforcement
- Structure of Seafood Supply Chains
- Challenges in Fishery Supply Chains
- Emerging Strategies for Progress
- Wastewater Pollution Introduction
- Existing Treatment Systems
- Impacts on Marine Life
- Impacts on Human Health
- Water Quality Monitoring
- Emerging Management Solutions
- Collaboration and Communication
- What is Remote Sensing?
- Optical and Radar Remote Sensing
- Challenges of Marine Remote Sensing
- Coral Reefs
- Allen Coral Atlas
- Global Mangrove Watch
- Regional Scale Mapping
- Island Scale Mapping
- Reef Scale Mapping
- Coral Colony Scale Mapping
- Climate Change Introduction
- Vulnerability Assessments
- Vulnerability Assessment Components
- Adaptation Design Tool
- Local Early Action Planning & Management Tool
- Coastal Resilience Tool
- Climate Vulnerability and Capacity Analysis Handbook
- Communicating Climate Change
- Managing for Social Resilience
- Blue Carbon Benefits
- Ecosystem Loss
- Assessing Carbon Stocks
- Gender Equity
- Integration into National Policies
Strategies for Shifting Tourist Behavior to Better Meet Local Resilience Goals
Tourist behaviors can negatively impact the local environment and communities. Direct negative impacts from tourists at reef sites can include trampling of corals and dunes, increased pollution, boat-related damage including anchor damage, vessel groundings, or collisions with marine species, and the introduction of invasive species. Changing tourist behavior and eventually shifting social norms at sites can minimize the negative environmental impacts of tourism and optimize benefits for reefs and local communities.
Topics explored during the 2021 Solution Exchange included potential methods for persuading, motivating, or otherwise enabling tourists to change their behavior.
Key Takeaways
- It is important to understand what is meant by behavior . Behavior is an observable action – what you see someone doing – but often people confuse this with attitudes, awareness, feelings, values, or identity. Therefore, behavior change is seeing a change in someone’s actions.
- Small incremental steps over the long term are required to change people’s behavior and shift social norms . Reef managers can help make these changes by focusing on people’s actions. There are many things that influence people’s behavior, including attitudes, capability, opportunity, social norms, and the unconscious influences: context, biases, emotions, and habits. Therefore, just because you inform or educate someone does not mean they will change their behavior.
- Identify and define the exact behaviors you want to change . Keep drilling down and be specific (i.e., who, where, when, what) about the behavior as this helps target it.
- Understand the behaviors, the drivers behind them, and the perspectives of the people whose actions you are trying to change . What motivates you to behave in a certain way may not motivate someone else who has different life experiences. Try to understand the behavior from the audience’s perspective, and then design a behavior change program that matches what we understand now from the audience’s perspective.
- To help change people’s behavior : 1) Keep messaging simple and focus on outcomes instead of complex science, 2) Use local champions (e.g., church leaders or well-known people from the community), and 3) Use pledges (or something similar) to make the message mainstream. See examples of behavior change campaigns and watch a webinar on the 4Fiji Campaign .
- Continually promote best practices in the community. It is critical to repeatedly promote best practices and have a sustained dialogue to effectively embed messages into the communities and shift social norms. This can be done on several different platforms, and if this is done successfully, eventually behavior change funding should no longer be required.
- Encourage outreach in local schools . To effectively utilize students, be specific about the type of behavior you want to change because children can be influential at changing certain behaviors in adults, but not others.
- Local and international/distant tourists will respond to different messages . Local visitors might respond better to messages about the value and identity of the place, while international/distant tourists might respond better to messages about improving their visitor experience.
Spotlight on New Caledonia
How can we develop our tourism sector sustainably?

Photo © Amy Armstrong
The Lagoons of New Caledonia in the South Pacific has 1,574,300 ha of reef and became a UNESCO World Heritage site in 2008. While tourism is earmarked to be an important future driver of the economy, it is currently a relatively little developed industry making up only approximately 4.1% of New Caledonia’s gross national product.
New Caledonia is looking for creative ways to grow their tourism sector to generate income and support livelihoods in a sustainable way. While growing the tourism sector, New Caledonia stakeholders want to ensure they maintain the ecological and cultural values of the many islands. Part of this challenge is to develop ways to persuade visitors to behave in a respectable manner around significant cultural and ecological sites.
Since the tourism industry in New Caledonia is still relatively undeveloped, the COVID-19 pandemic did not have a large impact on the economy of the country like some other RRI sites.
Presentations
Watch the presentations by Solution Exchange experts in English or French to learn more:
An Introduction to Behaviour and It’s Influencers – Mark Boulet, BehaviourWorks Australia, Monash University
Rugby players, fish boards, facebook and more as fiji reimages conservation campaigns to shift social norms and create durable change – scott radway, cchange, management and protection – fiona merida, great barrier reef marine park authority, une introduction aux comportements des visiteurs et ce qui les influencent – mark boulet, behaviourworks australia, monash university, les îles fidji réimaginent les campagnes de sensibilisation pour des changements de comportements durables – scott radway, cchange, gestion et protection – fiona merida, great barrier reef marine park authority, advancing sustainable tourism strategies.
The Solution Exchange was intended to inspire thinking, bring together the Resilient Reefs Initiative managers and partners for knowledge exchange and learning, and help catalyze action on the ground. Toward that end, here is the potential next step that was identified during discussion about changing tourist behavior:
Identify opportunities for shared messaging about appropriate tourist behavior across the UNESCO World Heritage Marine sites.
Acknowledging how commonly shared these challenges are, there was discussion about the potential to develop some common messages around appropriate tourist behavior across the UNESCO World Heritage Marine sites, specifically leveraging work already done on the Great Barrier Reef.

Strategic Communication Planning Process
Behaviour Change for Nature: A Behavioral Science Toolkit for Practitioners
Identifying Beliefs Underlying Visitor Behaviour
Great Barrier Reef Marine Park Authority Master Reef Guides

An official website of the United States government
The .gov means it’s official. Federal government websites often end in .gov or .mil. Before sharing sensitive information, make sure you’re on a federal government site.
The site is secure. The https:// ensures that you are connecting to the official website and that any information you provide is encrypted and transmitted securely.
- Publications
- Account settings
Preview improvements coming to the PMC website in October 2024. Learn More or Try it out now .
- Advanced Search
- Journal List
- Psychol Res Behav Manag
Understanding the Relationship Between Tourists’ Consumption Behavior and Their Consumption Substitution Willingness Under Unusual Environment
Keheng xiang.
1 China Institute of Regulation Research, Zhejiang University of Finance and Economics, Hangzhou, 310018, People’s Republic of China
2 School of Hotel and Tourism Management, The Hong Kong Polytechnic University, Kowloon, 999077, Hong Kong, Special Administrative Region of China
3 Zhejiang Technical Institute of Economics, Hangzhou, 310018, People’s Republic of China
Chonghuan Xu
4 School of Business Administration, Zhejiang Gongshang University, Hangzhou, 310018, People’s Republic of China
Introduction
Understanding the relationship between tourists’ consumption behavior and their willingness to substitute consumption in unusual environments can promote tourists’ sustainable consumption behavior. This study explores the internal relationship between tourists’ willingness to engage in sustainable consumption behavior and the substitution of tourism consumption willingness in an unusual environment and the related factors.
Through qualitative and quantitative mixed research, this study first invited 32 interviewees related to the tourism industry to conduct in-depth and focus group interviews and extracted a research model based on the push-pull theoretical model (PPM) through three rounds of coding of grounded theory. Then, through questionnaire design, pre-release, and formal release, 268 valid questionnaires were collected using a convenience sampling method, and the hypothesis and its mediating effect were verified using a structural equation model.
Further quantitative analysis and verification showed that being in an unusual environment had a positive effect on tourists’ perception of crisis awareness, safety risk, and willingness to engage in sustainable consumption behavior. However, the results did not support the unusual environment positively affecting the substitution of tourism consumption willingness, the psychological transformation cost, and the fixed consumption habit negatively affecting the substitution of tourism consumption willingness. In this study, two mediating variables were used to verify the indirect effect of being in an unusual environment and the substitution of tourism consumption willingness. The results showed that the mediating effect was significant.
This study explored an action mechanism model aimed at guiding tourists’ willingness for sustainable consumption, based on the environment and consumption behavior, and provided relevant countermeasures for the government and business decision-makers, enterprises, and investors in the tourism sector.
Carbon emissions and ecological sustainability in the process of tourism have become a common concern of the international community. The role of tourists in sustainable consumption and the integration of economic development and ecological civilization are both important. Sustainable tourists are green travel tourists who consider environmental protection during their travels. At present, the huge increase in consumption has brought great pressure to the human living environment. Tourists’ behavior and choice preference in travel are the keys to promoting sustainable ecotourism. Tourist activity includes accommodation, tours, and entertainment, all of which consume a certain amount of energy and contribute to carbon emissions. Furthermore, the potential safety and crisis of tourists during tourism consumption process under unusual environment, to a certain extent, lead to the enhancement of tourists’ self-protection consciousness and the formation of negative attitude, which will prompt tourists to have different consumption behavior that may cause the waste of resources. Understanding the relationship between tourists’ consumption behavior in an unusual environment and their willingness to substitute consumption may make visitors more willing to engage in sustainable tourism consumption.
This study follows the scientific and normative research procedure, starting with micro psychological variables, constructing a theoretical model, and putting forward a research hypothesis based on pushing, pulling, mooring, and other variable elements and breaks away from the previous decision-making mode of tourists’ sustainable consumption behavior and psychology. Thus far, studies have often focused on sustainable tourism behavior, psychological attribution, empirical research, and influencing factors. Research on the intrinsic willingness and effect of tourists’ consumption behavior under special circumstances has been neglected, so this research provides facts that rely on planned behavior theory and attitude (behavior) situational theory research paradigm and takes the unusual environment as the situational element. It provides a new research perspective for opening the internal “black box” of the micro psychological decision-making of sustainable consumption in the tourism industry. In this study, tourists’ sustainable consumption refers to their conscious choice of sustainable and environment-friendly tourism behavior during travel. From the perspective of connotation, tourists’ sustainable consumption includes reducing direct environmental pollution caused by tourism and consciously engaging in responsible tourism. In terms of denotation, sustainable consumption includes the whole continuum of tourist behavior, such as the choice of types of tourism with low energy consumption and low pollution. In this study, a theoretical model was built based on grounded theory and the push-pull theoretical model (PPM), and the internal mechanism of the willingness of tourists in an unusual environment to engage in sustainable consumption behavior and their consumption substitution willingness was studied using mixed quantitative and qualitative research methods.
The main contributions of this paper are summarized as follows:
- We examined the internal mechanism determining tourists’ willingness to engage in sustainable consumption in an unusual environment.
- We found substitutable behavioral effects and factors that affect tourists and their paths of influence.
- We explored the micro psychological variables in tourist consumption behavior willingness and introduced tourists’ psychological variables and situational environmental variables for the first time, which expands the situational research on empirical analysis of sustainable consumption behavior.
The remainder of this paper is organized as follows. Literature Review provides a literature review. Theoretical Model Construction discusses the research methods and theoretical models. Model Construction and Hypotheses presents the hypotheses. Results of the Analysis and Hypothesis Testing provides the results analysis and hypothesis testing. Finally, Conclusions presents the discussion and conclusions.
Literature Review
The unusual environment.
In the context of the concept of the unusual environment proposed by Zhang, 1 the unusual environment refers to an environment outside of people’s daily life, study, and work (including both the natural and cultural environments). As Zhang noted, the psychological and behavioral characteristics of tourists in an unusual environment are abnormal. In a related study, Rogers introduced the concept of the usual environment, pointing out that it is often a complex environmental concept that includes geographical boundaries, frequency of access, and the scope of people’s daily activities (living, working, studying, etc.) and that the usual environment is a unique situation as a whole, with its own history and significance, which is to some extent a function of geographical distance. 2 De San Eugenio Vela et al proposed that the usual environment represents a space or place and that space is an abstract physical concept; they also examined individual details, such as the visiting frequency of attractors (for calculating distance) and the perception of the usual environment through a super-large sample survey. 3
In academic studies, the dimensions of the current environmental situation are usually understood to include economic, information, cultural, cognitive, and economic dimensions. 4 , 11 Belk proposed that being in an unusual environment means to encounter strangeness and feeling unsafe, leading tourists, in general, to try to overcome the psychological distance to their usual environment by making more efforts to reduce strangeness, which also takes into consideration behavioral sunk costs. 5 McKercher pointed out from the perspective of physical distance that the sunk cost contained in the unusual environment more or less affected tourists’ choice of destination and their consumption there. 6 Research on the information dimension of an unusual environment focuses on issues such as chaos and asymmetric information; for example, Beales et al suggested that in an unusual environment, a lack of understanding of the price and quality of goods could easily lure visitors to tourist traps. 7 Gursoy noted that tourists rely on second-hand information channels more than they would in their usual environment, thus leading to chaos, information overload, and fuzzy information. 8 Lu found that tourists’ information search and filtering costs are higher in the non-habitual environment. 9 Regarding the cultural dimension, there is a higher incidence of cultural conflict than in the usual environment. Crompton noted that cultural distance caused discomfort, conflict, and discrimination in an unusual environment and investigated the source of cultural distance between the usual routine environment and that of the tourist destination. 10 Ye also proposed that cultural distance acts as a buffer in cross-cultural communication between hosts and guests, reducing conflict between them and concluded that cultural differences between habitual and unusual environments are important representations of the tourism activity space. 12 In terms of the cognitive dimension of an unusual environment, researchers have mainly focused on environmental perception and cognition, including risk safety, familiarity, and strangeness. For example, Cohen mentioned in as early as 1972 that tourists sought both familiarity and strangeness in the process of social contact with host countries. 13 To give another example, Mitchell and Greatorex proposed that the unusual environment accompanied by strangeness would increase tourists’ risk perception, while the environment cover could reduce such perception. 14 As for the empirical analysis of the unusual environment, Chen proposed that usual and unusual environments have the function of switching and projecting, with two combined effects of active passivity and positive passivity, which will generate the perception of insecurity and discomfort. The experience of tourism is a combination of the time and space of tourists’ (non) unusual environment and (non) leisure time. 15 Hares et al pointed out that tourists have barriers to sustainable consumption in unusual environments, so they seldom pay attention to environmental impacts or interests in their tourism decision-making. 16 In an unusual environment, because their identity is unknown, the moral constraints of tourists are relaxed, their self-discipline is lower, and behavior that do not occur in the habitual environment occur easily.
In summary, information chaos and cultural conflict in an unusual environment will lead to confusion in tourists’ cognition and a decrease in their sense of experience, psychological strangeness and sense of crisis and the corresponding psychological adjustments and behavioral decisions to respond to the surrounding tourism environment. Therefore, the theoretical model constructed in this study is based on the relevant research on the information and cognitive dimensions in an unusual environment, deepening and expanding the empirical analysis of tourists’ consumption behavior and willingness to substitute consumption.
Sustainable Consumption Behavior
In terms of the mechanism model of sustainable consumption willingness, research has typically focused on overload tourism in Europe, and studies on the mechanism and countermeasures for sustainable tourism saturation have been from the perspectives of policy, organization, institution, and behavior. 17 There have also been studies on models of relevant decision-making mechanisms to promote the implementation of sustainable consciousness by identifying potential factors in sustainable tourism, 18 such as determining the driving factors in specific tourism environments to formulate rules for the precision and standardization of sustainable tourism for tourists. Since the role of architecture is often neglected in research on sustainable tourism, to achieve the promotion and penetration of sustainable tourism, the internal mechanism architecture of tourists and the environment should be changed. 19 In general, the current sustainable tourism consumption mechanism model carries out relevant research by examining the internal potential factors in attitude and behavior from an objective perspective and how it can be applied in practice.
In recent years, studies of the factors influencing sustainable consumption willingness have focused on consumer behavior and cognition, such as Lao, 20 who concluded that consumers’ innovation consciousness has a significant impact on sustainable consumption intention. Lu et al found that consumers’ personality characteristics have a significant impact on their moral beliefs and that some dimensions of consumers’ moral beliefs have a significant predictive effect on their willingness to buy sustainable products. 21 Pinto et al examined how the salience of personal and social identity changes the relationship between sustainable consumption and intention types. 22 The results show that when personal identity is significant, the intention to transcend the self has more influence on sustainable consumption than the intention to promote one’s self-interest. When social identity is significant, the influence of intention to transcend the self and promote one’s self-interest in sustainable consumption are similar. Nguyen et al theoretically developed and tested two key regulators of the relationship between sustainable consumption intentions and behavior from the perspective of consumer behavior, that is, the availability of sustainable products and personal consumption expenditure (PCE). 23
Substitution of Tourism Consumption Willingness
There are many forms of consumption substitution. This study focuses on consumption substitution, that is, alternative consumption or consumer behavior, when choosing substitutes. In an unusual environment, tourists’ perception of safety risks will be enhanced, and the sense of insecurity and strangeness will prompt them to choose other forms of tourism to replace the original type of tourism or to engage in alternative tourism behavior. Consumption substitution in this study is based on the concept of substitution in Porter’s five forces model, 24 which holds that substitution is the process by which one product or service replaces another to achieve certain needs for the buyer and that substitution analysis is equally applicable to products and processes. The object of substitution here usually refers to the category (category substitution), and the substitution originally referred to by Porter is concerned with consumer products. This study extends Porter’s concept of substitutes by examining the transformation of the mode of consumption (consumption substitution behavior). As few studies have considered the issue of consumption substitution, this study examines consumption substitution behavior in the process of participating in tourism activity. This type of tourism substitution behavior is the result of tourists’ attention and awareness of environmental protection. It is one of the behavioral results of promoting tourists’ green consumption and it can transform tourists’ intention of green consumption behavior into a process of consumption substitution.
Previous studies that have examined similar issues include an examination of the migration of purchase channels by Reinartz et al 25 and a paper by Ratneshwar et al 26 on how to provide consumers with alternative product platforms and to offer a comparison standard for products in alternative schemes. Consumption substitution is generally a transformation of long-term trends, usually occurring at an industry level. This study examines the corresponding consumption mode and behavior substitution.
The Push-Pull Theoretical Model (PPM)
The PPM model (pull, push, and mooring) began with the study of the earliest migration behavior. Heberle summarized the structure and spatial distribution of population migration mechanisms, which gave rise to the initial push-pull theory of population migration. 27 Moon found further factors in migration theory, such as those that encourage people to leave their original habitats, for example, if their former residence had a negative effect on their lives. 28 Some scholars believe that the PPM model is also an effective approach for analyzing the relationship between consumer motivation and behavior. Therefore, it has been introduced to the field and the factors that influence consumer behavior are studied around the three factors “push”, “pull” and “mooring”.
For example, Goossens studied the motivation of tourists and their emotion-oriented destination selection decisions using the PPM model and proposed that tourists are driven by their emotional needs and interests. 29 In recent years, scholars have turned to the PPM model more frequently to study tourism consumers. For example, Kim et al examined the push and pull factors that increase visitors to South Korea’s national parks. 30 The results of their factor analysis showed that there were four push factors: appreciating nature as a family, escaping the obligations of daily life, engaging in exploration, and establishing a friendship. The three pull factors were the core tourism resources: information, facility convenience, and transportation/accessibility. In another study, Klenosky used the means-ends theory to examine the relationship between driving and pulling factors that motivate and guide travel behavior. 31 Jung et al tested the conversion adaptation behavior of PPM in tourists’ choice of airlines and concluded that PPM is directly related to tourists’ willingness to change airlines. 32 Poor service, opaque prices, low levels of customer satisfaction, and weak trust push tourists away from existing airlines. The attraction of alternative options, opportunities, and price concessions can motivate tourists to choose new routes, while other factors such as high alternative costs, limited choice trends, and low priority alternative costs, have anchoring effects.
Theoretical Model Construction
Overall design.
This study designed a qualitative and quantitative research based on the literature review of the above three important variables and in conjunction with the theoretical model of PPM. It attempted to find explanatory variables through a qualitative analysis, constructed a theoretical framework for the PPM, and then verified the framework through a quantitative analysis.
There are no definite categories, scales, or related theoretical assumptions available for studying sustainable consumption behavior patterns. In a preliminary investigation and interviews, many respondents pointed out the lack of clear boundaries and connotations of sustainable consumption behavior, especially sustainable consumption in travel, as everyone had a different understanding of the issues involved. It was obvious that this could give rise to misunderstandings if a structured questionnaire were to be administered without taking this into account. As this could affect the sample of the quantitative research directly, as well as the reliability and validity of the results, a mixed research method was adopted in the present study. A qualitative research method was first used to establish a theoretical framework and was then combined with variable detection and qualitative research results, which were proposed and verified using a quantitative research method.
This study first used a semi-structured interview, a qualitative approach, and sampling theory to select the interview objectives. Based on grounded theory, an exploratory study was conducted to collect verbatim transcripts of interviews from a representative sample of the public. Through open coding, spindle coding, and selective coding of the verbatim transcripts using the MAXQDA2018 software package, a correlation model, and the influencing factor theory of tourists’ willingness to engage in sustainable consumption and substitutive behavior were constructed. In the process of analyzing verbatim manuscripts, a continuous comparative analysis was adopted to refine and revise the theories continuously until the theories and concepts were saturated. The concepts were verified with the variables after sorting out the theories. After verification, the related variables were measured for concept, model hypothesis, and model validation.
Category Extraction and Theoretical Model Construction
A total of 32 invited tourism industry experts, scholars, and professionals (middle-aged and young teachers) participated in the survey. A combination of individual in-depth interviews and focus group interviews was used. Overall, there were 16 one-on-one interviews (each 30 to 45 minutes) and 4 focus group interviews with an average of 4 people in each group (each about 1 hour 30 minutes). Participants provided consent before participating in this research and to record the interviews. The interviews were transcribed using a recording software, and the total length of the interview transcripts was 180,000 words. This study randomly selected two-thirds of the interviews for consistency, using the theoretical concepts of the saturation test and trend chart. In open coding category extraction, only concepts that were repeated more than thrice in setting the initial concepts were selected, while less frequently occurring concepts were eliminated. Table 1 shows part of the initial concepts and categories. Owing to a space problem, for each of the initial categories, only the raw data of the three original materials and the corresponding initial concepts were selected. The main axis coding mined and extracted potential logical relations between categories. Table 2 shows the open coding categories. This study classifies different categories according to their conceptual interrelations and logical relations and summarizes eight main categories. The typical relational structures of the main categories in this study are listed in Table 3 .
Initial Concepts and Categories
Categorization of Open Coding
Typical Relational Structure of the Main Categories
This study identified the core category of sustainable consumption behavior and the consumption substitution willingness. The storyline around the core category can be summarized as an unusual environment, sustainable consumption behavior psychological costs, and fixed consumption. The study used the PPM theoretical model to identify the thrust factors (push) that can promote sustainable consumption behavior. Pull factors for sustainable consumption behavior include urging tourists to choose alternative tourism consumption types include a sense of risk to safety and crisis cognition. The psychological transformation cost and consumption habits of tourists have an anchoring effect (mooring) in this model, which will hinder the formation of tourists’ willingness to consume instead of traveling. Therefore, the theoretical model developed in this study is consistent with the PPM model. A specific theoretical model based on PPM is shown in Figure 1 . To test the saturation of theories and concepts, one-third of the interview records were used for the theoretical saturation test. Neither new categories and relationships nor new factors in the five main categories were found. Figure 2 shows the trend consistency chart of categories. The number of new categories shows a linear trend distribution and the number of new categories of interviewees from P9 to P16 is greatly reduced, indicating that the categories of interviewees have obvious internal consistency. The above theoretical model based can thus be considered theoretically saturated.

This study is based on the theoretical model of PPM.

Trend chart of category consistency.
Model Construction and Hypotheses
Measurement and analysis of variables, push factors.
The usual environment: Based on Ajzen’s theory of planned behavior (TPB), 33 , 34 individual environmental behavioral willingness is considered the first psychological variable. In this study, the concept of the usual environment is understood in a manner similar to that proposed by Gursoy et al 8 and Crompton, 10 with an emphasis on the information dimension and the related characteristics of the cultural dimension, that is, that in unusual circumstances, a situation of information asymmetry and chaos occurs, with conflicts resulting from cultural distance and discomfort. Therefore, based on the environmental behavior scale proposed by Stern and the four dimensions identified in the literature review (economy, information, culture, and cognition), seven question options were set.
Pull Factors
Sustainable consumption behavior: Stern et al argued that tourists’ sustainable consumption behavior was affected by environmental values and social norms, combining the attitude - behavior - situational theory with a focus on the individual environmental behavior associated with external situation factors. 35 Recently, many scholars have studied and analyzed the situational factors that affect behavior, as the paper by Stern et al, who proposed that environment and policy support can influence consumer behavior. 36 Therefore, with reference to the environmental behavior scale proposed by Stern et al and the appropriate modification of Ajzen’s theory of planned behavior scale, eight sustainable consumption behavior measurement questions were designed based on the perspectives of housing, travel, tourism, shopping, and entertainment.
The willingness of tourism consumption substitution: Consumption substitution in this study is the concept of total substitution in Porter’s five-force model. 24 With reference to the new environmental paradigm (NEP) scale developed by Dunlap and combined with the results of the existing literature review, six options (mainly situational measurement items for consumption to replace tourism behavioral intentions) were designed.
Crisis and safety risk perception: based on the NEP scale developed by Dunlap et al and the results of the existing literature review, seven options for crisis and risk safety perception were designed (mainly for the perception and judgment of non-sustainable tourism). 37
Anchoring Factors
Psychological transformation costs and fixed consumption: Conversion costs are faced in the conversion of one-time costs. 38 , 39 Related studies have shown that conversion costs are important factors in the process of consumers’ offline to online channel migration. Therefore, because of the cost of the transformation of psychological perception, the migration behavior of tourists may be suppressed. 40 , 41 With reference to Dunlap’s NEP scale and combined with the findings of existing literature, six items of psychological transformation cost and fixed consumption were designed (mainly measuring the anchoring effect of benefit perception).
Research Model and Research Hypothesis
Using grounded theory and the PPM as this study’s theory correlation model, the usual role is the thrust of the unusual environment variables; positive roles are crisis and security risk perception, sustainable consumption behavior, and the willingness to substitute tourism consumption. 38 , 42 As variables of pull forces, crisis and security risk perception have a positive influence on sustainable consumer behavior. 43–47 Psychological transformation costs and fixed consumption have a negative impact on the substitution of willingness to consume tourism. 48 , 49 To ensure the accuracy of the model and hypothesis construction, two mediating variables were introduced into this study: crisis and safety risk perception and sustainable consumption behavior. It is assumed that these two variables play a mediating role in influencing consumption substitution willingness in an unusual environment. The research hypotheses are presented in Table 4 .
Hypothesis of This Study
The research model of this study was constructed through the above theoretical analysis and research hypotheses, as shown in Figure 3 .

Research model.
Questionnaire Design and Descriptive Statistics
This study randomly recruited 15 ordinary tourists to conduct focus group discussions on the outcome and impact variables and invited 6 professors from the academic tourism studies field and 3 experts from the tourism industry to analyze the contents and questions of the focus group discussions. The results of the discussions of the tourists, academic professors, and experts were fully summarized and refined. The relevant outcome and influence variables were selected, which confirmed the results of the literature review. On this basis, this study designed the initial questionnaire, which was distributed by researchers in the field of tourism as part of the pre-test. The questionnaire’s content structure and topics were inspected and evaluated using the SPSS 24.0 software reliability test data and deleted if they did not conform to the standard question based on the results of the test. Moreover, part of the subject expressions was also adjusted in the multi-item colloquial correction and in the green tourism consumption concepts; further, notes were added to the scene and concept descriptions.
Considering that hotel accommodation is an obligatory choice for overnight tourists in an unusual environment and their consumption behavioral willingness is more representative, overnight tourists traveling in Hangzhou were selected as the objects of the survey. The convenience sampling method was adopted to represent the front desk of H&H Hotels among mainstream budget hotels. The front desk service staff cooperated with the sharing of a questionnaire link for tourists to fill in and submit on their mobile phones.
From July 15, 2019, to July 20, 2019, five members of this group in Hangzhou, China, gathered a total of 280 questionnaires. After deleting incomplete samples, there remained 268 valid questionnaires, which gave an effective response rate of 95.7%. The sample ratio was roughly 51.6:48.4 and the age group best represented was between 25 and 45 years (64.8%), the level of education was bachelor’s degree holders (67.8%), and the monthly income bracket was RMB 5500–8000 (56.7%). The sample thus conformed to the next-stage characteristics of travel tourist properties. The variable descriptions and statistical descriptions are presented in Table 5 .
Variable and Statistical Description
According to the different use purposes, a confirmatory factor analysis (CFA) was performed to verify the theoretical model, that is, to test the ability of the model to fit the actual data with pre-defined factors. First, an exploratory factor analysis was carried out on the behavioral variables and then the measurement model was tested through CFA to ensure the reliability and validity of the model. Finally, the SEM model was used to verify the research hypothesis and the bootstrap method was used to test the indirect effect sizes of the two mediation routes to ensure the effectiveness of the mediation variable test.
Results of the Analysis and Hypothesis Testing
Testing the measurement model.
To measure the reliability and validity, a CFA was performed on the measurement model. CFA is a research method that determines whether the correspondence between measurement factors and measurement items (scale items) is consistent with the predictions of the researchers. Its main purpose is to analyze the validity of convergence and to verify the measurement items belonging to the same factor at the time of measurement. In this study, AVE (average variance extracted) and CR (composite reliability) were combined for analysis. If the AVE of each factor is greater than 0.5 and the CR value is greater than 0.7, it indicates good polymerization validity. Simultaneously, this study checked whether the factor load coefficient corresponding to each measurement item was greater than 0.7.
In general, the factor load of the CFA analysis was between 0.5 and 0.95, indicating that the model has good adaptability. Table 6 lists the factor loads of all the variables. All factor loads from Y1 to X28 were between 0.5 and 0.95, so all the questions were retained. The combined reliability was greater than 0.5 and the mean variation extraction was greater than 0.5. The combination reliability of all the potential variables was above 0.7, indicating that the internal consistency of each variable was good. The AVE of all the variables exceeded the minimum value of 0.5 and the correlation coefficient between all the variables was less than the square root of the AVE ( Table 7 ), indicating that the measurement model had good aggregation and discriminant validity.
Reliability and Validity Tests of the Measurement Model
Correlation Coefficient Matrix Between Variables
Note : The value on the diagonal of the matrix is the square root of the average variance extract.
Analysis of the Structural Model Results
Figure 4 shows the influence path of the structure model and its normalized path coefficient, and Table 8 lists the results of hypothesis testing. The unusual environment had a significant positive impact on tourists’ perception of crisis and safety risk (score = 0.392, t = 4.4, p < 0.001) and on their sustainable consumption behavior (score = 0.243, t = 3.0, p < 0.001) but no significant impact on substitution of tourism consumption willingness (p >0.5). Therefore, H1 and H2 are supported, while H3 was not. The perception of crisis and safety risk had a significant positive affect on the substitution of tourism consumption willingness (score = 0.355, t = 3.4, p < 0.001), so hypothesis H4 is supported. The willingness to engage in sustainable consumption behavior had a significant positive affect on the substitution of tourism consumption willingness (score = 0.494, t = 4.8, p <0.001), so hypothesis H5 is supported. However, the psychological transformation cost and the fixed consumption habit had no significant influence on the willingness to replace tourism with consumption (ie, score = 0.021, t = 0.3, p > 0.5), so hypothesis H6 is not supported.
Results of the Hypothesis Test: Direct Action
Notes : (1) *** represents the P value less than 0.001 for significance level (P < 0.001). (2) solid line arrow indicates that the influence path is established, dotted line arrow indicates that the influence path is not established.

Analysis results of the influence path of the structural model.
Because there are two parallel mediating variables in this model, to verify their reliability, the indirect effect size of the two mediating routes was tested using the bootstrap method. The test data are presented in Table 9 . The results show that P < 0.01, indirect effect size > 0.01, and there is a significant mediating effect.
Results of Hypothesis Testing Mediation
Conclusions
Conclusions and discussion.
Through a mixture of qualitative research based on grounded theory and quantitative model verification, this study explores the willingness of tourists to engage in sustainable consumption behavior in an unusual environment and the substitution of tourism consumption willingness. 50 , 51 The results show that, first, being in an unusual environment has a positive relationship with tourists’ perceptions of crisis and safety risk. 52 Tourists can consume instead of going through problem identification, cognition, and the prediction of an unusual environment. 53 , 54 Being in an unusual environment will prompt tourists to review their knowledge and attitudes toward sustainable consumption and construct and strengthen values for sustainable consumption by themselves. 55–59 Crisis and safety risk perceptions are positively correlated with the substitution of tourism consumption willingness. 60 , 61 Tourists can identify the crisis and safety risks and make decisions on their own crisis interests to enhance the substitution of tourism consumption willingness to reduce travel. However, willingness to engage in sustainable consumption behavior is positively correlated with the substitution of willingness to consume tourism. The values of sustainable consumption held by tourists will promote changes in tourists’ own consumption mode and will be influenced by social norms, promoting willingness to replace tourism with consumption. 62 , 63
Second, as an intervening variable, crisis and safety risk awareness has a significant effect on sustainable consumption behavior, as strangeness in the usual environment will increase tourists’ perception of risk and strengthen their willingness to consume as an alternative to tourism. Therefore, crisis and safety risk perception positively regulate the relationship between the environment and consumption behavior to engage in the substitution of tourism consumption willingness. 64 As for the mediating variable of willingness to engage in sustainable consumption behavior, this can also positively adjust the relationship between the unusual environment and the substitution of tourism consumption willingness. In an unusual environment, tourists’ ecological and sustainable tourism values are easy to awaken, and the substitution of tourism consumption willingness will be significantly enhanced. 65
Third, as the mooring effect in PPM model theory has not been confirmed, the psychological transformation costs and fixed consumption of tourists are mainly affected by mindset and tourists’ own interest decision-making, but the correlation between them and the substitution of tourism consumption willingness has not been confirmed. 66 , 67 The unusual environment directly acting on the substitution of tourism consumption willingness has not been confirmed. The study found that an unusual environment plays a correlating role with two mediating variables, namely, the perception of risks to safety and sustainable consumption behavior, through a crisis.
The theoretical contribution of this study is mainly reflected in two aspects: First, it introduces a new environmental variable and uses this variable as the core to build an understanding of the substitution of tourism consumption willingness. This theoretical structural model and the use of the two mediating variables in moderator variable correlation functions extends and expands the current academic focus on the single perspective of the usual environment and may be conducive to the further study of the usual environment as a variable in tourists’ travel behavior and experiences. However, tourists’ psychological and situational environmental variables are introduced for the first time, expanding, and enriching the situational and empirical research on sustainable consumption behavior.
In the process of planning and development of tourist attractions, the government should pay attention to the “push” effect under an unusual environment to create a familiar and safe tourism environment for tourists, design suitable instructions, and create guidelines to form rich and varied publicity channels to promote the generation of sustainable tourism under unusual environment. Tourism enterprises should reduce redundant facilities and high-energy tourist items in the process of developing tourist attractions. The generation of sustainable tourism behavior requires tourists to integrate their own accurate identification under unusual environments, establish the mentality of safety risk cognition, and replace tourism behavior that may have an impact on the ecological environment with sustainable tourism consumption behavior.
Limitations
As related studies have found, tourism is a low-frequency activity that has different rates of consumption and frequency of revisiting. 68 The apparent time-limited characteristic of tourism activity may dampen tourists’ enthusiasm toward the idea of sustainable consumption and, from the usual environment to the usual circumstances, not only is the change geographical but tourists’ individual behavior patterns and psychology also change. 69 , 70 In a heterogeneous environment, tourists’ personal sustainable consumption behavior pattern will also change. Since this is a dynamic game process, it is also one of the research limitations of this study; one of its hidden assumptions is that it treats the willingness of tourists to engage in sustainable consumption and sustainable consumption behavior as inevitable, while in fact, there is a large gap between tourists’ willingness and their actual behavior. Although tourists may engage in sustainable consumption in different environments and situations, this does not necessarily represent a full implementation. The relevant laws and ways to positively motivate sustainable consumption in tourists also need to be further examined through in-depth studies. Although the willingness to engage in sustainable consumption and consumer behavior has been the subject of a great deal of research, 70–72 there is still need for further study of the effect of being in a heterogeneous environment similar to the usual environment. In addition, dynamic game research on tourists’ sustainable consumption behavior in unusual environments also needs to be further discussed.
Funding Statement
This research is supported by the Philosophy and Social Science Foundation of Zhejiang Province (21NDJC083YB), National Natural Science Foundation of China (71702164), Natural Science Foundation of Zhejiang Province (LY20G010001). Soft Science Research Program of Science and Technology Department of Zhejiang, China (2021C35059), Philosophy and Social Science Planning Special Project of Zhejiang Province (20GXSZ26YB).
Ethics Statement
We declare that participants in our research study allow us to use their data for academic research and publication. All the participants were anonymous and their data was protected. All participants provided informed consent and this study was conducted in accordance with the Declaration of Helsinki. All the programs in our research study were approved by the Institutional Review Board of Zhejiang University of Finance and Economics.
The authors declare that they have no conflicts of interest for this work.
Trip chaining patterns of tourists: a real-world case study
- Published: 14 September 2023
Cite this article
- Cong Qi 1 ,
- Jonas De Vos 2 ,
- Tao Tao 3 ,
- Linxuan Shi 4 &
- Xiucheng Guo 1
346 Accesses
3 Altmetric
Explore all metrics
Insights into tourist travel behaviours are crucial for easing traffic congestions and creating a sustainable tourism industry. However, a significant portion of the literature analysed tourist travel behaviour by predefined tourist trip chains which result in the loss of more representative classification. Using tourist travel survey data from Nanjing, China, this paper presents an innovative methodology that combines the tourist trip chain identification and the trip chain discrete choice model to comprehensively analyse the travel behaviour of tourists. The discretized trip chains of tourists are clustered using the ordering points to identify the clustering structure (OPTICS) clustering algorithm to identify typical tourist trip chains, which will then be considered as the dependent variable in the nested logit model to estimate the significant explanatory variables. The clustering results show that there are two main categories, namely single and multiple attraction trip chains, and seven subcategories, which were named according to the characteristics of trip chains. The clustering result is analysed and three main trip chain patterns are derived. Departure city, travel cost, travel time, and travel mode show significant influence on the choice between single and multiple attraction trip chains. The urban attraction trip chain is more favoured by tourists with children, and the typical trip chain shows stronger dependence on travel intention. Visiting Lishui for the first time only affects the choice of the multiple suburban attraction trip chain. These findings are valuable for optimising tourist public transport infrastructure, promoting travel by public transport and better tourism management.
This is a preview of subscription content, log in via an institution to check access.
Access this article
Price includes VAT (Russian Federation)
Instant access to the full article PDF.
Rent this article via DeepDyve
Institutional subscriptions
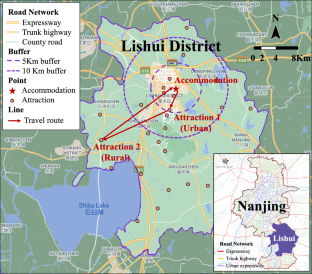
Trip chaining propensity and tour mode choice of out-of-home workers: evidence from a mid-sized Canadian city
Naznin Sultana Daisy, Lei Liu & Hugh Millward

A tour-based analysis of travel mode choice accounting for regional transit service
Chuan Ding, Yao-yu Lin, … Sabyasachee Mishra

Role of the built environment on trip-chaining behavior: an investigation of workers and non-workers in Halifax, Nova Scotia
Tufayel Chowdhury & Darren M. Scott
Afshardoost, M., Eshaghi, M.S.: Destination image and tourist behavioural intentions: a meta-analysis. Tour. Manag. 81 , 104154 (2020). https://doi.org/10.1016/j.tourman
Article Google Scholar
Ankerst, M., Breunig, M.M., Kriegel, H.-P., et al.: OPTICS: ordering points to identify the clustering structure. ACM SIGMOD Conf. 28 (2), 49–60 (1999). https://doi.org/10.1145/304182.304187
Balac, M., Horl, S., Schmid, B.: Discrete choice modeling with anonymized data. Transportation (2022). https://doi.org/10.1007/s11116-022-10337-1
Bautista-Hernández, D.A.: Individual, household, and urban form determinants of trip chaining of non-work travel in México City. J. Transp. Geogr. 98 , 103227 (2022). https://doi.org/10.1016/j.jtrangeo.2021.103227
Chen, X., Wan, X., Li, Q., et al.: Trip chain based travel mode shares driven framework using cellular signaling data and web based mapping service data. Transp. Res. Rec. 2673 (3), 51–64 (2019). https://doi.org/10.1177/0361198119834006
Chen, Y., Dai, Y., Liu, A., et al.: Can the COVID-19 risk perception affect tourists’ responsible behavior intention: an application of the structural equation model. J. Sustain. Tour. (2021). https://doi.org/10.1080/09669582.2021.1977938
Daisy, N.S., Millward, H., Liu, L.: Trip chaining and tour mode choice of non-workers grouped by daily activity patterns. J. Transp. Geogr. 69 , 150–162 (2018). https://doi.org/10.1016/j.jtrangeo.2018.04.016
Daisy, N.S., Liu, L., Millward, H.: Trip chaining propensity and tour mode choice of out-of-home workers: evidence from a mid-sized Canadian city. Transportation 47 (2), 763–792 (2020). https://doi.org/10.1007/s11116-018-9915-2
Duan, Z., Wang, C., Zhang, H.M., et al.: Using longitudinal mobile phone data to understand the stability of individual travel patterns. Transp. Res. Rec. 2643 (1), 166–177 (2017). https://doi.org/10.3141/2643-18
Feng, X., Sun, H., Wu, J., et al.: Trip chain based usage patterns analysis of the round trip carsharing system: a case study in Beijing. Transp. Res. Part A Policy Pract. 140 , 190–203 (2020). https://doi.org/10.1016/j.tra.2020.08.017
Gao, G., Sun, H., Wu, J.: Activity based trip chaining behavior analysis in the network under the parking fee scheme. Transportation 46 (3), 647–669 (2019). https://doi.org/10.1007/s11116-017-9809-8
García, J., Juaneda, C., Raya, J.M., et al.: A study of traveller decision making determinants: prioritizing destination or travel mode? Tour. Econ. 21 (6), 1149–1167 (2015). https://doi.org/10.5367/te.2015.0517
Gross, S., Grimm, B.: Sustainable mode of transport choices at the destination public transport at German destinations. Tour. Rev. 73 (3), 401–420 (2018). https://doi.org/10.1108/tr-11-2017-0177
Gutiérrez, A., Miravet, D.: The determinants of tourist use of public transport at the destination. Sustainability 8 (9), 908 (2016). https://doi.org/10.3390/su8090908
Hahsler, M., Piekenbrock, M., Doran, D.: Dbscan: fast density based clustering with R. J. Stat. Softw. 91 (1), 1–30 (2019). https://doi.org/10.18637/jss.v091.i01
Halat, H., Zockaie, A., Mahmassani, H.S., et al.: Dynamic network equilibrium for daily activity-trip chains of heterogeneous travelers: application to large-scale networks. Transportation 43 (6), 1041–1059 (2016). https://doi.org/10.1007/s11116-016-9724-4
Hedau, A.L., Sanghai, S.S.: Development of trip generation model using activity based approach. Int. J. Civil Struct. Environ. Infrastruct. Eng. Res. Dev. 4 (3), 61–77 (2014)
Google Scholar
Hermawati, P., Adisasmita, S.A., Ramli, M.I., et al.: Choices models of trip chain and transportation mode for international tourists in tourism destination island. Int. J. Geomate (2019). https://doi.org/10.21660/2019.55.88460
Karl, M.: Risk and uncertainty in travel decision making: tourist and destination perspective. J. Travel Res. 57 (1), 129–146 (2018). https://doi.org/10.1177/0047287516678337
Khan, M., Machemehl, R.B.: Analyzing tour chaining patterns of urban commercial vehicles. Transp. Res. Part A Policy Pract. 102 , 84–97 (2017). https://doi.org/10.1016/j.tra.2016.08.014
Kieu, L.M., Bhaskar, A., Chung, E.: Passenger segmentation using smart card data. IEEE Trans. Intell. Transp. Syst. 16 (3), 1537–1548 (2015). https://doi.org/10.1109/tits.2014.2368998
Kim, H.-R., Yi, C., Jang, Y.: Relationships among overseas travel, domestic travel, and day trips for latent tourists using longitudinal data. Tour. Manage. 72 , 159–169 (2019). https://doi.org/10.1016/j.tourman.2018.11.018
Kim, S., Lee, S., Ko, E., et al.: Changes in car and bus usage amid the COVID-19 pandemic: relationship with land use and land price. J. Transp. Geogr. (2021). https://doi.org/10.1016/j.jtrangeo.2021.103168
Krizek, K.J.: Neighborhood services, trip purpose, and tour based travel. Transportation 30 (4), 387–410 (2003). https://doi.org/10.1023/a:1024768007730
Lew, A.A., McKercher, B.: Modeling tourist movements: a local destination analysis. Ann. Tour. Res. 33 (2), 403–423 (2006). https://doi.org/10.1016/j.annals.2005.12.002
Li, L., Cao, M., Yin, J., et al.: Observing the characteristics of multi activity trip chain and its influencing mechanism. KSCE J. Civ. Eng. 24 (11), 3447–3460 (2020). https://doi.org/10.1007/s12205-020-1927-8
Lue, C.C., Crompton, J.L., Fesenmaier, D.R.: Conceptualization of multi-destination pleasure trips. Ann. Tour. Res. 20 (2), 289–301 (1993). https://doi.org/10.1016/0160-7383(93)90056-9
Ma, X., Wu, Y.J., Wang, Y., et al.: Mining smart card data for transit riders’ travel patterns. Transp. Res. Part C Emerg. Technol. 36 , 1–12 (2013). https://doi.org/10.1016/j.trc.2013.07.010
Ma, X., Wang, Y., McCormack, E., et al.: Understanding freight trip chaining behavior using a spatial data mining approach with GPS data. Transp. Res. Rec. 2596 , 44–54 (2016). https://doi.org/10.3141/2596-06
Mariante, G.L., Ma, T.-Y., Van Acker, V.: Modeling discretionary activity location choice using detour factors and sampling of alternatives for mixed logit models. J. Transp. Geogr. 72 , 151–165 (2018). https://doi.org/10.1016/j.jtrangeo.2018.09.003
Miao, L., Im, J., Fu, X., et al.: Proximal and distal post-COVID travel behavior. Ann. Tour. Res. 88 , 103159 (2021). https://doi.org/10.1016/j.annals.2021.103159
Nanni, M., Pedreschi, D.: Time-focused clustering of trajectories of moving objects. J. Intell. Inform. Syst. 27 (3), 267–289 (2006). https://doi.org/10.1007/s10844-006-9953-7
Oppermann, M.: A model of travel itineraries. J. Travel Res. 33 (4), 57–61 (1995). https://doi.org/10.1177/004728759503300409
Pop, R.-A., Saplacan, Z., Dabija, D.-C., et al.: The impact of social media influencers on travel decisions: the role of trust in consumer decision journey. Curr. Issues Tour. (2021). https://doi.org/10.1080/13683500.2021.1895729
Qi, C., Zhu, Z., Guo, X., et al.: Examining interrelationships between tourist travel mode and trip chain choices using the nested logit model. Sustainability. 12 (18), 7535 (2020). https://doi.org/10.3390/su12187535
Scheiner, J., Holz-Rau, C.: Women’s complex daily lives: a gendered look at trip chaining and activity pattern entropy in Germany. Transportation 44 (1), 117–138 (2017). https://doi.org/10.1007/s11116-015-9627-9
Schneider, F., Ton, D., Zomer, L.-B., et al.: Trip chain complexity: a comparison among latent classes of daily mobility patterns. Transportation 48 (2), 953–975 (2021). https://doi.org/10.1007/s11116-020-10084-1
Shiftan, Y.: Practical approach to model trip chaining. Transp. Res. Rec. 1645 , 17–23 (1998). https://doi.org/10.3141/1645-03
Talwar, S., Srivastava, S., Sakashita, M., et al.: Personality and travel intentions during and after the COVID-19 pandemic: an artificial neural network (ANN) approach. J. Bus. Res. (2021). https://doi.org/10.1016/j.jbusres.2021.12.002
Tang, X., Wang, D., Sun, Y., et al.: Choice behavior of tourism destination and travel mode: a case study of local residents in Hangzhou, China. J. Transp. Geogr. 89 , 102895 (2020). https://doi.org/10.1016/j.jtrangeo.2020.102895
Tanjeeb, A., Hyland, M.: Exploring the role of ride hailing in trip chains. Transportation 50 , 959–1002 (2022). https://doi.org/10.1007/s11116-022-10269-w
Vu, H.Q., Li, G., Law, R., Ye, B.H.: Exploring the travel behaviors of inbound tourists to Hong Kong using geotagged photos. Tour. Manage. 46 , 222–232 (2015). https://doi.org/10.1016/j.tourman.2014.07.003
Wong, I.A., Fong, L.H.N., Law, R.: A longitudinal multilevel model of tourist outbound travel behavior and the dual cycle model. J. Travel Res. 55 (7), 957–970 (2016). https://doi.org/10.1177/0047287515601239
Wong, I.A., Law, R., Zhao, X.: Time variant pleasure travel motivations and behaviors. J. Travel Res. 57 (4), 437–452 (2018). https://doi.org/10.1177/0047287517705226
Wu, L., Zhang, J., Fujiwara, A.: Dynamic analysis of Japanese tourists’ three stage choices: tourism participation, destination choice, and travel mode choice. Transp. Res. Rec. 2322 , 91–101 (2012). https://doi.org/10.3141/2322-10
Xiang, Z., Magnini, V.P., Fesenmaier, D.R.: Information technology and consumer behavior in travel and tourism: insights from travel planning using the internet. J. Retail. Consum. Serv. 22 (1), 244–249 (2015). https://doi.org/10.1016/j.jretconser.2014.08.005
Yang, Y., Fik, T.J., Zhang, J.: Modeling sequential tourist flows: where is the next destination? Ann. Tour. Res. 43 , 297–320 (2013). https://doi.org/10.1016/j.annals.2013.07.005
Yang, L., Shen, Q., Li, Z.: Comparing travel mode and trip chain choices between holidays and weekdays. Transp. Res. Part A Policy Pract. 91 , 273–285 (2016). https://doi.org/10.1016/j.tra.2016.07.001
Download references
This research was funded by Postgraduate Research&Practice Innovation Program of Jiangsu Province, Grant Number KYCX23_0303.
Author information
Authors and affiliations.
School of Transportation, Southeast University, No.2 Dongnandaxue Road, Nanjing, 211189, China
Cong Qi & Xiucheng Guo
Bartlett School of Planning, University College London, 14 Upper Woburn Place, London, WC1H 0NN, UK
Jonas De Vos
Department of Civil and Environmental Engineering, Carnegie Mellon University, Pittsburgh, PA, 55454, USA
Department of Civil and Environmental Engineering, The George Washington University, Washington, DC, 20052, USA
Linxuan Shi
You can also search for this author in PubMed Google Scholar
Contributions
CQ: conceptualization, investigation, formal analysis, methodology, writing—original draft, resources, software. JDV: project administration, supervision, writing—review and editing. TT: validation, writing—review and editing. XG: formal analysis, funding acquisition. LS: data curation, visualization.
Corresponding author
Correspondence to Xiucheng Guo .
Ethics declarations
Conflict of interest.
Conflict of interest on behalf of all authors, the corresponding author states that there is no conflict of interest.
Additional information
Publisher's note.
Springer Nature remains neutral with regard to jurisdictional claims in published maps and institutional affiliations.
Rights and permissions
Springer Nature or its licensor (e.g. a society or other partner) holds exclusive rights to this article under a publishing agreement with the author(s) or other rightsholder(s); author self-archiving of the accepted manuscript version of this article is solely governed by the terms of such publishing agreement and applicable law.
Reprints and permissions
About this article
Qi, C., De Vos, J., Tao, T. et al. Trip chaining patterns of tourists: a real-world case study. Transportation (2023). https://doi.org/10.1007/s11116-023-10418-9
Download citation
Accepted : 15 August 2023
Published : 14 September 2023
DOI : https://doi.org/10.1007/s11116-023-10418-9
Share this article
Anyone you share the following link with will be able to read this content:
Sorry, a shareable link is not currently available for this article.
Provided by the Springer Nature SharedIt content-sharing initiative
- Travel behaviour
- OPTICS cluster
- Nested logit model
- Find a journal
- Publish with us
- Track your research

10 Common Behaviors of Highly Creative People
Creativity is a unique blend of personality traits..
Posted March 27, 2024 | Reviewed by Davia Sills
- Creativity is a combination of several familiar behaviors.
- Creativity is not just for the few, but is available to all.
- Anyone can become more creative when they turn creativity into a daily habit.
Two old friends. A rainy afternoon. Vanilla lattes at Starbucks. Divergent conversations about life, the world, and the best tiramisu in town. An inquiry about my forthcoming book on creativity : “What are some of the characteristics of creative people?”
According to an article in Scientific American , “Creative work blends together different elements and influences in the most novel, or unusual, way, and these wide-ranging states, traits, and behaviors frequently conflict with each other within the mind of the creative person.” In essence, creative people have discovered that their creativity is a blend of diverse interests, influences, and behaviors—a combination routinely and systematically practiced every day.
10 Key Creative Behaviors
Interestingly, we all have one or more of those characteristics. We utilize several of them as children, and we become aware of others as we enter the workforce. The ultimate truth of creativity is that all these behaviors are available for those eager to improve or increase their “Creativity Quotient.” Let’s take a look.
1. Creative people search for possibilities rather than absolutes.
Creative people are uncomfortable with the status quo. For them, a creative life is one of options, opportunities, and alternatives. They do not always accept what others do; rather, they seek multiple responses and views. In fact, the most powerful question they routinely ask is the one beginning with the words “What if…?”

2. Creative people are dreamers—daydreamers.
Daydreaming, from a creativity standpoint, is a good thing. It’s not something we should prevent as we engage in intellectual tasks.
Having one’s “head in the clouds” is an opportunity to let our creative powers develop and flourish. This is mental play at its finest—a potent exercise in which innovative thinking is supported and celebrated.
3. Creative people spend considerable time outdoors.
Nature has the ability to evoke a creative way of thinking by making us more curious and able to embrace new ideas and by stimulating us to become more flexible thinkers. “Nature is the great visible engine of creativity, against which all other creative efforts are measured,” said Terrance McKenna in a talk in the early ’90s. “Nature’s creativity is obviously the wellspring of human creativity.”
4. Creative people are open to learning new things.
Their formal education is just a starting point, a foundation for additional educational opportunities. Creative people embrace a continuous learning process in a wide variety of fields—often areas having little to do with their occupational specialty. A teacher who takes a cooking class. An architect who goes on an archeological tour of Greece. A dentist who reads books about the history of China. An author who learns how to tap dance.
5. Creative people meditate and practice mindfulness .
Research reported in the Harvard Business Review demonstrated that just 10 minutes of meditation a day can increase our creative powers. The simple act of “taking time off” is sufficient to calm the mind and offer opportunities to create and innovate. The key is to make meditation and mindfulness a regular part of our daily activities—a commitment to find a quiet place and let our thoughts flow.
6. Creative people are independent.
They can make their own decisions and follow through on them. They don’t always need advice and counsel from others; they can think (and act) for themselves. They are comfortable taking on new challenges without the pressure of approval from others. Although they will work with others, they frequently consider their best work to be solo work.
7. Creative people are open-minded.
Open-minded individuals always embrace new ideas and new ways of doing things. They are often able to see the big picture because they furiously pursue all the unique ways of examining the details of that experience. They examine a variety of possibilities rather than simply looking for a single right answer. They like to try new things just because. For them, every new situation is a learning situation, not necessarily a means to an end.

8. Creative people are passionate.
They follow their dreams —traveling through new experiences simply because they offer new possibilities. They don’t always follow the beaten path but rather the road less traveled, the sights not seen. They find joy in their pursuits and are happy to share them with others. They are, in so many ways, optimistic explorers of the unknown.
9. Creative people are risk-takers.
They take chances. They examine the unknown—not necessarily because it will lead to something successful but rather because it’s new. They’re happy to move out of their comfort zone and play with new ideas. Most importantly, they are not afraid of failure because they see failure as a learning opportunity. Or, to quote Ralph Waldo Emerson, “People succeed when they realize that their failures are the preparation for their victories.”
10. Creative people practice creativity every day.
For creative people, creativity is not an occasional activity but rather a lifelong commitment. According to my forthcoming book (see References), when we make creativity a regular habit, we are “training” our minds to address all sorts of mental challenges.
It’s similar to running a world-class marathon. You have to run several days (actually, several years) in advance of the big event in order to be competitive. Without that day-to-day training, you jeopardize your chances of finishing. The same holds true for creativity.
One thing about the list above—there is absolutely no mention of intelligence or IQ. As shared in previous columns, high intelligence is not a prerequisite for creativity. Being very smart and being very creative may, actually, be two mutually different concepts.
What is more important—especially for those who wish to enhance their creativity—is to constantly pursue, refresh, and take advantage of the attributes above. Every day!
Fredericks, Anthony D. Two-Minute Habits: Small Habits, Dynamic Creativity (forthcoming book – Spring 2024).
Kaufman, S.B. (December 24, 2014). The messy minds of creative people. [Blog post.] Scientific American . blogs-scientificamerican.com/beautiful-minds/2014/12/24/the-messy-minds-of-creative-people.
Mckenna, Terrance as quoted in “Opening the Doors of Creativity.” Ask TMK (October 20, 1990) ( https://www.asktmk.com/talks/Opening+the+Doors+of+Creativity ).
Schootstra, Emma, Dirk Deichmann, and Evgenia Dolgova. “Can 10 Minutes of Meditation Make You More Creative?” Harvard Business Review (August 29, 2017).

Anthony D. Fredericks, Ed.D. , is Professor Emeritus of Education at York College of Pennsylvania. His latest book is In Search of the Old Ones: An Odyssey Among Ancient Trees (Smithsonian Books, 2023).
- Find a Therapist
- Find a Treatment Center
- Find a Psychiatrist
- Find a Support Group
- Find Teletherapy
- United States
- Brooklyn, NY
- Chicago, IL
- Houston, TX
- Los Angeles, CA
- New York, NY
- Portland, OR
- San Diego, CA
- San Francisco, CA
- Seattle, WA
- Washington, DC
- Asperger's
- Bipolar Disorder
- Chronic Pain
- Eating Disorders
- Passive Aggression
- Personality
- Goal Setting
- Positive Psychology
- Stopping Smoking
- Low Sexual Desire
- Relationships
- Child Development
- Therapy Center NEW
- Diagnosis Dictionary
- Types of Therapy

Understanding what emotional intelligence looks like and the steps needed to improve it could light a path to a more emotionally adept world.
- Coronavirus Disease 2019
- Affective Forecasting
- Neuroscience
These 5 road trips from Las Vegas will take you far beyond casinos and glitz

Apr 5, 2024 • 6 min read

Not far from the glitz of the Strip, the open road offers desert adventures © JacobH / Getty Images
In a city filled with the atypical, it’s easy to fall into the typical tourist routine in Las Vegas .
The generationally accepted Sin City mantra is to gamble, catch a show, gamble some more, have a few drinks, enjoy a little entertainment…and repeat as many times as humanly possible until you have to stagger back to the airport and catch your flight home. Vegas’ two tourist zones, the Strip or Downtown/ Fremont Street , are within a 15-minute drive of one another; if you stay in one, perhaps you’ll make an excursion to the other. And that’s the extent of a “day trip” for most.
Yet far too many visit Las Vegas without exploring the top-notch historical, geographical and cultural attractions nearby, many of which are within a three-hour drive. By renting a car, you can coast through the likes of Red Rock Canyon and Valley of Fire of State Park within 45 minutes (though we recommend taking more time, to explore the orange rock formations in both by hiking).
It’s pretty easy to navigate Las Vegas and surrounding areas via generally well-kept and well-paved roadways, with Interstate 15 (running north-south), Clark County Rte 215 (a beltway encircling the city) and a US Rte 95 (a northwest-southeast diagonal) the key roads to know.
It’s true that Las Vegas is surrounded by desert, and this arid region doesn’t abound with notable road-trip stops. But quality makes up for quantity, and you’ll find a world of wonder awaits within reach of Sin City: think the Grand Canyon, Hoover Dam, quirky hotels, national parks…and so much more.
Here are three true day trips – plus two additional multi-day options – that will help expand your Las Vegas horizons.

1. Grand Canyon West
Best road trip to do via bus Las Vegas–Grand Canyon West Skywalk; 125 miles (201km); allow one (long) day
The Western Rim of the Grand Canyon (known as Grand Canyon West ) is within a two-and-a-half-hour bus ride of Las Vegas. Tour operators like Grand Canyon Destinations , Gray Line and GC Tours pack it all in one day, making early morning pick-ups, allowing three-or-so hours of free time and stopping for optional meals. The “must” at Grand Canyon West is a tip-toe along the cantilevered, glass-bottomed Skywalk .
Planning tip: Grand Canyon West is operated by the Hualapai Nation (whereas Grand Canyon National Park is under the purview of the National Park Service). From Las Vegas, a trip to the national park will take substantially more time, and should be a multi-day affair.

2. Boulder City
Best road trip for history lovers Las Vegas–Boulder City; 26 miles (42km); allow one day
While this city is only a 30-minute drive southwest of Las Vegas, it feels a world apart. Whereas the Strip is all about creative destruction and ever-bigger resorts, Boulder City has more than 500 buildings on the National Register of Historic Places, most of which were constructed in the 1930s and ’40s. The city came into being in the ’30s, when workers from across the USA converged to build nearby Hoover Dam ; you can learn all about the key figures at the Boulder City/Hoover Dam Museum . En route to the majestic dam – just 15 minutes northeast of Boulder City – stop at Hemenway Park , which offers panoramic vistas of the often bright-blue Lake Mead .
Detour: Henderson is Nevada ’s second-largest city, and its Water St artery regularly hosts car shows, parades and farmers markets.

3. Laughlin
Best road trip for a river reprieve Las Vegas–Laughlin; 97 miles (156km); allow one day
On the southern tip of Nevada on the Colorado River, you’ll find this cozy, casino-filled town. Along north-south main drag Casino Dr, you’ll see a handful of gambling names that you’ll also find in Las Vegas, including Golden Nugget , Harrah’s and Tropicana . So why Laughlin ? Its appeal boils down to cheaper table games, less swank and river adventures aplenty.
Water excursions come in all forms here, including guided kayaking journeys with Desert River Outfitters , Jet Ski rentals with Watercraft Adventures or hikes along the Colorado River Heritage Greenway Trail , which runs adjacent to the river.

Best road trip for seeing another side of the Silver State Las Vegas–Reno; 438 miles (705km); allow 4–5 days
With its vast green landscapes, a slower pace and small-town vibes, northern Nevada is a different world from Las Vegas. Its anchor is Reno – aka the “Biggest Little City in the World,” a nickname proudly proclaimed by an arched sign in the city’s Commercial Row core. Reno is a nearly 7-hour drive from Vegas following US Rte 95.
En route, stop at the Goldfield Hotel , the 1902 hallmark of an eerily quiet town and regarded as one of the most haunted structures in the US. Keep that haunted streak going with a visit to the Clown Motel in Tonopah , which also has a free clown museum in its lobby. Tonopah is also stargazing heaven, hosting a biweekly “Star Party” after dark every April through October. Telescopes and binoculars are provided to get up close and personal with the constellations.
Once you arrive in Reno, hit the Reno Brewery District , which has more than 15 craft spots. Nevada’s first meadery, the Black Rabbit Mead Company uses locally sourced honey in its brews.

5. Zion National Park
Best road trip for outdoors enthusiasts Las Vegas–Springdale, Utah; 159 miles (256km); allow 4–5 days
Within a two-hour drive of Sin City, a world of emerald pools, soaring pine-lined trails and the Angels Landing bucket-list hike await. And for all the wonder you’ll find within Zion National Park , getting there from Las Vegas is half the fun. Along the way – generally a straight-north shot on I-15 – stop at Valley of Fire State Park to see mounds of sandstone with red patterns reminiscent of a cinnamon bun, as well as 2000-year-old petroglyphs etched in caves. Continue north to the city of St George, just over the Utah border. Red mountains loom in the distance over its historic downtown and art district; pop in the St George Art Museum for rotating exhibits that showcase the Western USA ’s rocky and rugged beauty.
As you approach Zion, Springdale, the quaint town at the park’s southern gate, has southwest-inspired souvenir shops, hotel-chain outposts and the five-star LaFave Luxury Resort , which has villas that sleep up to 10. If want to camp in the park, Watchman Campground is open year-round, with reservations accepted up to six months ahead of booking.
Detour: Tucked off Interstate 15, Mesquite is a golfer’s paradise, with nine public courses – including the Jack Nicklaus–designed Coyote Springs Golf Club – within a 10-minute radius of town.
Explore related stories

National Parks
Apr 3, 2024 • 6 min read
A trio of treasures, Florida’s national parks cater those who love everything wild and offbeat about the Sunshine State. Here’s all you need to know.

Apr 2, 2024 • 8 min read

Apr 1, 2024 • 5 min read

Mar 30, 2024 • 4 min read

Mar 30, 2024 • 5 min read

Mar 29, 2024 • 6 min read

Mar 25, 2024 • 8 min read

Mar 15, 2024 • 10 min read

Mar 13, 2024 • 3 min read
4.8 magnitude earthquake rattles NYC, New Jersey: Live updates
NEW YORK – A 4.8 magnitude earthquake recorded in New Jersey that shook residents in surrounding states and New York City on Friday morning was one of the strongest in state history.
The temblor was reported about 5 miles north of Whitehouse Station, New Jersey, at about 10:23 a.m. Friday, according to the United States Geological Survey. The epicenter was about 45 miles from New York City, where residents reported shaking furniture and floors.
“Earthquakes in this region are uncommon but not unexpected. It’s likely people near the epicenter are going to feel aftershocks for this earthquake in the magnitude 2-3 range, and there’s a small chance there can be an earthquake as large or larger, following an earthquake like this,” Paul Earle, a seismologist at the USGS Earthquake Hazards Program told reporters. “In terms of our operations, this is a routine earthquake … Immediately we knew this would be of high interest and important to people who don’t feel earthquakes a lot.”
People reported feeling the shaking as far north as Maine and as far south as Norfolk, Virginia, following the quake, according to USGS. Scientists said those in the affected area should listen to local emergency officials and be prepared to seek cover if aftershocks occur.
“If you feel shaking, drop, cover and hold,” Earle said.
No major disruptions or damage have been reported in New Jersey or New York.
"We have activated our State Emergency Operations Center. Please do not call 911 unless you have an actual emergency," said New Jersey Gov. Phil Murphy.
President Joe Biden spoke with Murphy about the earthquake and the White House is monitoring the situation.
“He thinks everything's under control,” Biden told reporters before leaving the White House for a trip to Baltimore. “He’s not too concerned about it, the governor of New Jersey, so things are all right.”
New York Gov. Kathy Hochul said the quake was felt throughout New York, and officials are assessing impacts and any potential damage.
In Yonkers, New York, Mayor Mike Spano said City Hall shook but no injuries were reported.
"A few moments ago our entire house shook for about 25 seconds or so here in Mendham, New Jersey," former New Jersey Gov. Chris Christie said.
USGS is still investigating the exact fault line at the center of Friday’s quake and said it occurred in a region with dozens of fault lines that were more active millions of years ago.
At least 2 aftershocks in first few hours after earthquake
Sara McBride, a scientist with the USGS Earthquake Hazards Program, said the agency has recorded at least two aftershocks related in the first few hours after the quake struck. The agency continues to refine its aftershock forecast for this event.
“There’s a 3% chance of magnitude 5 or greater in the next week related to this earthquake,” McBride said during a news briefing.
USGS scientists also said informal observations can be a big help in understanding earthquakes, especially in a region where they’re less common.
“We encourage people to fill out the ‘Did You Feel It?’ reports on our website,” McBride said. “This citizen science project is critical in terms of building our knowledge around earthquakes.”
By midafternoon on Friday, the agency said it had received more than 161,000 reports, and extrapolated that the quake had been felt by millions of people. McBride acknowledged that earthquakes can be nerve-wracking for people who don’t live in seismologically active regions, and said knowledge is power in combatting that discomfort.
“The best thing you can do to relieve any unsettling feelings you might have is to learn how to protect yourself during shaking and how to prepare for earthquakes in the future,” she said.
Man getting vasectomy during earthquake recounts experience
One Horsham, Pennsylvania, man shared his unusual earthquake experience, saying the tremors hit when he was in the middle of receiving a vasectomy.
"The surgeon sort of froze and all of us kind of seemed a bit confused," Justin Allen told USA TODAY . "Even when the surgeon said 'that’s gotta be an earthquake,' I thought he was joking."
Luckily, Allen's doctor was able to resume the procedure after a brief pause, and the rest went off without a hitch. Now recovering at home, Allen said it's an experience no one involved will forget, especially because his social media post about the incident has since gone viral.
"My wife says that 'this is a clear and obvious sign that we should not have any more kids,'" Allen said.
New Jersey resident thought sound from earthquake was an explosion
Madeline Nafus had just finished feeding her 7-week-old baby when, simultaneously, she was thrown off balance and the loudest sound she’d ever heard rang out.
“I thought it was either an explosion or a bombing because of how loud it was,” said Nafus, who lives in Long Valley, New Jersey, a few miles from the earthquake's epicenter. “It was just terrifying.”
Nafus, 29, watched as her light fixtures swung and wine glasses, framed photos and a 6-foot elk head crashed onto the floor. Feeling as if her “house was going to crumble,” she picked up her baby boy, grabbed some blankets and headed outside. Meanwhile, her friend came running downstairs and picked up Nafus’ quivering dog, Olivia, a small golden doodle.
After about 15 seconds, the rumbling went away and only occasional, minor tremors could be felt. Nafus called her husband, who was teaching a golf lesson at the time, and then their 2-year-old’s day care.
“They said the children were all confused and asking a lot of questions but that they were OK,” she said.'
How common are East Coast quakes?
Earthquakes are less frequent in the eastern part of the country than in the west, but they have occurred in every state east of the Mississippi River, according to the USGS.
"Since colonial times people in the New York – Philadelphia – Wilmington urban corridor have felt small earthquakes and suffered damage from infrequent larger ones," according to the USGS. "Moderately damaging earthquakes strike somewhere in the urban corridor roughly twice a century, and smaller earthquakes are felt roughly every two to three years."
USGS officials also said that even smaller-magnitude quakes are more likely to be felt more widely on the East Coast than similar size quakes on the West Coast due to the rock properties of eastern soil, which can cause concern to East Coasters not used to the tremors.
Rocks in the eastern part of the country are much older than in the west, by up to millions of years. Those older rocks have been exposed to more extreme temperatures and pressure, and faults have had more time to heal. Seismic waves travel across the resulting harder and denser faults much more efficiently, so the effects of a quake are felt across a larger area. In the West, faults are newer and absorb more of the seismic wave energy without spreading as far.
Quake felt in Massachusetts
In Auburn, Massachusetts, more than 200 miles from the earthquake's epicenter, Jerry Steinhelper was on a video call for work when his house began to tremble. His dog Maize started barking, and books and trinkets fell from their shelves. He looked out the window and saw trees shaking.
“I thought at first it may be ice falling off the roof. But it kept going and the entire house was shaking,” he told USA TODAY. “Then I just knew it was an earthquake.”
Steinhelper, 55, lived in San Diego in the 1980s and experienced temblors there, but he’s never felt one in Massachusetts, where he’s been for over 25 years.
“It was an interesting 10 to 15 seconds,” he said.
'It felt like a plane crashed outside' near epicenter
Nicole Kravitz, 33, was baking muffins at the cafe she co-owns with her husband in New Jersey when the floor began to shake. She and the cooks looked at each other for a few moments, and then at some stacked plates and glasses that had started vibrating.
Their eatery, Branchburg's Best, is located in New Jersey's Somerset County, near the epicenter of Friday’s earthquake.
“It felt like a plane crashed outside,” she said. “No one knew what was happening.”
Some workers ran out the door to see if something had smashed into the building while she checked the basement for damage. Meanwhile, Patrick Tucker, her husband, who was picking up beef from a nearby farm, watched agitated chickens and cows run around in their pens, visibly shaken by the quake.
Kravitz said the intensity of the earthquake made her feel like she was back in Southern California, where she had lived for several years before she returned to her home state in 2016.
Quake was one of the strongest to ever impact New Jersey
Friday's earthquake was the most significant in New Jersey since 1884 , when an Aug. 10 earthquake somewhere near Jamaica Bay, New York, toppled chimneys and moved houses off their foundations as far as Rahway, New Jersey, 30 miles away.
Other than that quake, there were only three earthquakes in modern history that caused damage in the state: 1737 (New York City), 1783 (west of New York City) and 1927 (New Jersey coast near Asbury), according to New Jersey Office of Emergency Management records.
The Dec. 19, 1737 earthquake is believed by modern experts to have been a 5.2 magnitude quake. Charted as taking place in the greater New York City area, some accounts say its epicenter was near Weehawken. State records show it threw down chimneys. Chimneys were also hurled down during the Nov. 29, 1783 quake. Estimated at a 5.3 magnitude that originated in modern-day Rockaway Township, according to state records, it was felt from Pennsylvania to New England.
The Aug. 10, 1884 quake, estimated at a 5.2 magnitude was the last the state has seen of its significance and was felt from Virginia to Maine, according to state records.
Read more about New Jersey's earthquake history.
– David M. Zimmer, NorthJersey.com
New Jersey business owner describes worst quake ever felt but went right back to work
It was a busy day for La Bella Salon & Spa in Lebanon, New Jersey, when an earthquake struck near the rural township.
About a dozen stylists and customers, some whom were getting their hair dyed while others got manicures and eyelash extensions, all froze as the building rattled for about 30 seconds.
“People started to feel the shaking, and it got worse and worse. We were like ‘Oh, my god, what is going on?’" said shop owner Rosanne Drechsel. “I thought a truck hit the building or something.”
After the tremor subsided, nearly everyone in the building started receiving texts and phone calls from friends and family, Drechsel, 61, said.
Nothing was damaged and no one was injured, but Drechsel, who was born and raised in New Jersey, said it was “by far the worst earthquake” she had ever felt.
“We all went back to work and finished the appointments,” she said. “Customers are calling now to see if we're still open and if they can still make their appointments later on today.”
'It was scary': Quake rattles shelves in Brooklyn bodega
In Brooklyn, residents said they felt their buildings shake and many went outdoors after the rumbling stopped to check in with neighbors.
Julio Melo, a deli worker, said he thought the sounds of the earthquake resembled those of a large truck going down the street. But when Melo, 32, looked around and saw beer bottles rattling on store shelves, and a potted plant shimmy down the counter, he thought it might be something bigger, he told USA TODAY.
“I looked at my employee and he had the same tragic face on as me, it was scary,” he said at Jenesis’ Grocery Corp. in Brooklyn’s Bedford-Stuyvesant neighborhood.
– Claire Thornton
Where was the earthquake felt?
Residents and officials said the earthquake was felt throughout New York, as well as in New Jersey, Connecticut, Pennsylvania and elsewhere. It was also felt as far away as Cambridge, Massachusetts, about 250 miles away from the reported epicenter.
Charita Walcott, a 38-year-old resident in the Bronx borough of New York, said the quake felt "like a violent rumble that lasted about 30 seconds or so."
"It was kind of like being in a drum circle, that vibration," she said.
Earthquakes common in the region, but the size is unusual: Expert
Chuck Ver Straeten, a geologist and curator of sedimentary rocks at the New York State Museum, told USA TODAY it’s not surprising this earthquake happened where it did.
“New York, around New York City going into New Jersey, there’s a lot of earthquakes historically down there. Happens every year,” he said. But it’s less common for them to be of such a high magnitude. It’s not surprising that many people felt it, he said. Usually, earthquakes in the region are at a lower magnitude and less likely to be felt.
Ver Straeten said the real question now is if this is just a precursor to a larger quake.
“You never know what is the earthquake, what is a pre-earthquake, what is an earthquake happening after the main earthquake, you just have to see,” he said. “One slip along the rock fault, when one happens, it makes other areas around there more tense also and they start to slip and you slip again and slip again.”
But, he added, it would be unlikely for a larger quake to follow this one. In the Northeast, it’s more common for one large quake to be followed by smaller aftershocks, rather than a mounting series of tremors.
What does magnitude mean in an earthquake?
Magnitude is a measurement of the strength of an earthquake . Officially it's called the Moment Magnitude Scale . It's a logarithmic scale , meaning each number is ten times as strong as the one before it. So a 5.2 earthquake is moderate while a 6.2 is strong.
The magnitude and effect of an earthquake, according to Michigan Technological University :
◾ Below 2.5: Generally not felt
◾ 2.5 to 5.4: Minor or no damage
◾ 5.5 to 6.0: Slight damage to buildings
◾ 6.1 to 6.9: Serious damage
◾ 8.0 or greater: Massive damage, can totally destroy communities
Intensity scales, measured in Roman numerals, are used to describe how strong the earthquake felt to people in the area.
According to the California Earthquake Authority , an intensity of I is typically felt only under especially favorable conditions. A IV, which leads to light shaking, is felt indoors by many, but not typically outdoors. It might awaken some people at night and lead to a sensation like a truck striking a building. A parked car would rock. Intensities VI and above would be strong, frightening and felt by all, with the damage increasing up to a X where the shaking would be violent. Some well-built wooden structures would be destroyed and most masonry and frame structures along with their foundations would be ruined.
While you might have heard the term " the Richter Scale " used to describe earthquakes, it is no longer commonly used because it was only valid for certain earthquake frequencies and distance ranges.
This is a developing story and will be updated.
Contributing: Reuters
IMAGES
VIDEO
COMMENTS
A model of tourist shopping behavior is proposed and estimated to investigate differences in route choice behavior of various types of tourist shoppers. The results indicate that shopping supply and accessibility, some physical characteristics, and the history of the route followed are important factors influencing route choice behavior.
Analogous sustainable tourist behavior: Terms similar to 'sustainable tourist behavior', usually general and covering multiple sustainability pillars. ... for instance, the typical Eastern cultural elements such as face value, collective face value, and other traditional Chinese values such as Taoism and Confucianism (Su et al., ...
Fish out of water. The case of tourist behaviour is especially interesting for debates about ethical decision-making. At home, we may be bound to behave in a certain manner due to societal ...
This finding reflects a typical pat-tern of behavior across most cultures. ... Manuel Antonio National Park as a case study of tourism overcrowding, 7) Tourist behavior and dynamics of domestic ...
Tourist Behaviour and Trends 125. behaviours, and tourists differ according to nationality, culture, social. class, travel experience, etc. It is also important for profes sionals to review ...
This book delves into tourist behavior and sustainable tourism, especially in the post-pandemic era. Amid the pandemic, Ukraine-Russia tensions, social shifts, geopolitical changes, and climate concerns, the tourism industry has witnessed significant shifts in travel patterns.
Paola Passafaro, Ph.D, is a social and environmental Psychologist.Her research interests concern the understanding of the social-psychological determinants of ecologically relevant behavior. In this field, she has studied attitude-behavior relationship, attitude ambivalence, normative influence and personality correlates of individual waste disposal (recycling and littering behavior ...
Most of the existing research on tourist behaviors toward risk has focused on the variables of traditional behavioral theories (e.g., planned behavioral theory) or protective motivation theories (Bae & Chang, 2021; Wang, Liu-Lastres, Ritchie, & Mills, 2019; Zheng et al., 2021a). However, this study applied stress and coping theory as a way of ...
Tourist behavior is the process a tourist undertakes, both observable and unobservable, when planning and participating in tourism. It is the dynamic of affect and cognition, as well as biological and cultural forces interacting with marketing and environmental stimuli. In marketing, consumer behavior is a relatively young subfield that seeks ...
A systematic review on tourism energy consumption, sustainable tourism, and destination development: a behavioral perspective. Linghan Zhang, Junyi Zhang, in Transport and Energy Research, 2020. 13.5.1 Research on individual energy-related behavior and benchmark. Literature review suggests that individual energy-related behavior has been underresearched, which should be given more attention in ...
In this article, we propose a research framework that can help in comprehensively analyzing tourists' travel behavior from the perspective of the three main stages: before, during, and after the trip. A case study was conducted based on user-generated content data from the Old Town of Lijiang to verify the feasibility of the proposed research ...
Tourist impact management in ecotourism destinations requires an accurate description of tourists' spatiotemporal behavior patterns and recreation preferences to minimize the ecological environmental impact and maximize the recreation experience. This study classified tourist behaviors into five typical behavior patterns based on the digital footprints of tourists visiting Ziwuyu of the ...
Part C: Health Measures and Visitor Behavior in the new normal (SDG 3, 6, and 12).- 11. Sports tourism in the new normal.- 12. The Role of self-service technologies in the new normal of hospitality services.- Part D: Family Life Cycle, Employee Behavior, and Visitor Behavior in the new normal (SDG 3 and 8).- 13.
Judy Randall, CEO of travel and tourism research specialist company Randall Travel Marketing, feels that some of the perceived unruly behavior is merely a reaction to a shift in the way travelers ...
To help change people's behavior: 1) Keep messaging simple and focus on outcomes instead of complex science, 2) Use local champions (e.g., church leaders or well-known people from the community), and 3) Use pledges (or something similar) to make the message mainstream. See examples of behavior change campaigns and watch a webinar on the 4Fiji ...
With millions of people traveling to unfamiliar cities to spend holidays, travel recommendation becomes necessary to assist tourists in planning their trips more efficiently. Serving as a prerequisite to travel recommender systems, understanding tourist behavior patterns is therefore of great importance. Recently, geo-tagged photos on social media platforms like Flickr have provided a rich ...
Analyzing tourists' travel behavior at different stages of a trip can help to better understand their travel demands, providing valuable suggestions for destination management. In this article, we propose a research framework that can help in comprehensively analyzing tourists' travel behavior from the perspective of the three main stages: before, during, and after the trip.
Previous studies on sports tourism indicate that tourists' commitment to a destination, also known as destination loyalty, is an essential factor concerning the survival of the fittest and future success of a general or sporting destination (Jeong et al., 2019; Krishna & Schwarz, 2014; Lv et al., 2020).Building long-term relationships with tourists can be regarded as a less costly approach ...
The typical relational structures of the main categories in this study are listed in Table 3. Table 1. Initial Concepts and Categories. Category ... The generation of sustainable tourism behavior requires tourists to integrate their own accurate identification under unusual environments, establish the mentality of safety risk cognition, and ...
In this study, the nested logit (NL) model was chosen to explore travel behaviour, where the dependent variable was the typical trip chain identified by the OPTICS clustering algorithm ("Typical tourist trip chain identification" Section). The hierarchical structure of the NL model differs from the traditional logit models in terms of that ...
Introduction. Consumer behaviour (CB) involves certain decisions, activities, ideas or experiences that satisfy consumer needs and wants (Solomon, Citation 1996).It is 'concerned with all activities directly involved in obtaining, consuming and disposing of products and services, including the decision processes that precede and follow these actions' (Engel, Blackwell, & Miniard, Citation ...
It is typical for smart tourism to collect and analyze data extracted from different sources in combination with the use of advanced information technologies to transform travel experiences [2] to make it more enriched, ... Tourist behaviour analysis is a popular direction of scientific research. According to Reference [5]
Part B: Environmental sustainability and Tourist Behavior in the New Normal (SDG 7, 12, 13, 14 and 15) 6. The willingness of Dutch Travellers to travel pro-environmentally post-Covid-19.- 7. Tourist behavior for Sustainable Development in the Cumbres de Majalca National Park, Mexico. Challenges in a post-pandemic context.-
The simple act of "taking time off" is sufficient to calm the mind and offer opportunities to create and innovate. The key is to make meditation and mindfulness a regular part of our daily ...
4. Reno. Best road trip for seeing another side of the Silver State. Las Vegas-Reno; 438 miles (705km); allow 4-5 days. With its vast green landscapes, a slower pace and small-town vibes, northern Nevada is a different world from Las Vegas. Its anchor is Reno - aka the "Biggest Little City in the World," a nickname proudly proclaimed ...
A 4.8 magnitude earthquake rattled buildings in the New York City area on Friday morning. The temblor was reported about 5 miles east of Lebanon, New Jersey, at about 10:20 a.m. Friday, according ...