Stravl.org is solely used for administrative services. Stravl's user-facing website is available at

Stravl Data

Stravl is open-sourcing over 1,000,000 user travel preference data.
Gain access to Stravl's extensive travel preference data, the largest custom data set of its kind. You are free to use the data for any academic or commercial purposes. We're happy to help with questions, just reach out to [email protected] .
Stravl Data Repository
Download Stravl Data [317MB]
Optional Attribution:
Sursock, A. & Brooks, C. (2023). Stravl Travel Preference Data A. www.stravl.org/data.
Data Descriptions:
Stravl-Data is the world's largest, open-sourced data set of travel preferences. Through a user-facing website, Stravl gathered 80,301 travelers' vacation preferences. Users were asked to fill out a brief form on their ideal vacation preferences (such as expected experiences, scenery, and activity level) and logistical constraints (such as budget, traveler ages, and season). Thereafter, they were asked to "swipe" or "rate" ten destinations. Users have the option to respond with "Yes", "No", or "Maybe" in a Tinder-like rating framework. In total, over 1,000,000 user swipes were recorded. Lastly, users are shown 5 to 10 recommendations, which were selected using different ML-models. Those recommendations are recorded and users' feedback on them (through clicking a "smiley" or "frowny" face next to them) is stored. Personally-identifying information such as IP data, user names, or other metadata has been removed prior to the release of this dataset.
Stravl's extensive travel preference data is the largest custom data set of its kind. You are free to use the data for any academic or commercial purposes. We're happy to help with questions, just reach out to [email protected]. Below find a brief description of all columns in our data set.
Form Responses:
What age ranges are present in your travel group? [multiple selections possible]
What is your trip budget (per person, per night)?
2: $100-$249
What season are you planning to travel?
What are you looking to experience? Multiple selections encouraged.
1: Adventure
4: Nightlife
6: Shopping
What scenery are you seeking? Multiple selections encouraged.
3: Mountain
Activity Level
0: Chill & Relaxed
1: Balanced
Safety Conscious
0: Very Safety Conscious
2: Ready for Anything
Destination Popularity
0: Off the Beaten Path
1: Classic Spot
2: Mainstream & Trendy
Where do you want to go?
0: Anywhere
1: Specific Regions
Which specific regions? [If ‘Specific Regions’ is selected in FORM_R] [multiple selections allowed]
n: N. America
c: Caribbean
s: S. America
m: Mid. East
Swipe Responses:
Each of "yes_swipes", "no_swipes", and "maybe_swipes" includes a list of indices representing destinations a user swiped 'yes', 'no', or 'maybe' on. The indices can be transformed to its corresponding destination names through the "destination_ids" table.
Model, Recommendations, and Ratings:
Users were then recommended a set of 5 destinations (or 10 if a user wanted more). Different algorithms were used to recommend those destinations; the variables "model", "retrieval", and "dynaMatch" indicate which algorithms were used. Their implementations are not released, yet their selections are still shared for research purposes.
Each of the recommendation columns includes the names of recommended destinations in order of recommendation; if a column includes '-1' recommendations were not yet tracked at the time this user completed the form. Each rating column includes ant user ratings that were provided. If all ten columns are set to -1, ratings were not tracked at the time this user completed the form. If not, a rating of '-1' indicates a user's disapproval with the rating, and a rating of '1' indicates their approval of it. If the entry is empty, the user has not rated the corresponding destination.
For an updated version of Stravl Data, Star our GitHub repository here: https://github.com/Stravl/Stravl-Data
Thank you for visiting nature.com. You are using a browser version with limited support for CSS. To obtain the best experience, we recommend you use a more up to date browser (or turn off compatibility mode in Internet Explorer). In the meantime, to ensure continued support, we are displaying the site without styles and JavaScript.
- View all journals
- My Account Login
- Explore content
- About the journal
- Publish with us
- Sign up for alerts
- Data Descriptor
- Open access
- Published: 23 September 2021
A database of travel-related behaviors and attitudes before, during, and after COVID-19 in the United States
- Rishabh Singh Chauhan ORCID: orcid.org/0000-0001-7188-557X 1 ,
- Matthew Wigginton Bhagat-Conway ORCID: orcid.org/0000-0002-1210-2982 2 ,
- Denise Capasso da Silva ORCID: orcid.org/0000-0003-1414-8439 3 ,
- Deborah Salon ORCID: orcid.org/0000-0002-2240-8408 2 ,
- Ali Shamshiripour 1 ,
- Ehsan Rahimi ORCID: orcid.org/0000-0002-8649-7542 1 ,
- Sara Khoeini 3 ,
- Abolfazl (Kouros) Mohammadian ORCID: orcid.org/0000-0003-3595-3664 1 ,
- Sybil Derrible ORCID: orcid.org/0000-0002-2939-6016 1 &
- Ram Pendyala 3
Scientific Data volume 8 , Article number: 245 ( 2021 ) Cite this article
8762 Accesses
14 Citations
2 Altmetric
Metrics details
- Interdisciplinary studies
- Research data
The COVID-19 pandemic has impacted billions of people around the world. To capture some of these impacts in the United States, we are conducting a nationwide longitudinal survey collecting information about activity and travel-related behaviors and attitudes before, during, and after the COVID-19 pandemic. The survey questions cover a wide range of topics including commuting, daily travel, air travel, working from home, online learning, shopping, and risk perception, along with attitudinal, socioeconomic, and demographic information. The survey is deployed over multiple waves to the same respondents to monitor how behaviors and attitudes evolve over time. Version 1.0 of the survey contains 8,723 responses that are publicly available. This article details the methodology adopted for the collection, cleaning, and processing of the data. In addition, the data are weighted to be representative of national and regional demographics. This survey dataset can aid researchers, policymakers, businesses, and government agencies in understanding both the extent of behavioral shifts and the likelihood that changes in behaviors will persist after COVID-19.
Machine-accessible metadata file describing the reported data: https://doi.org/10.6084/m9.figshare.15141945
Effect of COVID-19 response policies on walking behavior in US cities

Mapping global variation in human mobility

Mobility networks in Greater Mexico City
Background & summary.
The COVID-19 pandemic has spread across the world, infecting tens of millions and killing over one million people 1 . By March 2021, the United States (U.S.) had recorded the highest number of confirmed COVID-19 cases and COVID-19 related deaths in the world 1 . Since social distancing is one of the most effective measures in containing the spread of the infection 2 , several U.S. states issued various restrictions including stay at home orders. Moreover, numerous restaurants and bars closed for dine-in services, various recreation facilities were shut down, many offices and schools switched from meeting in-person to meeting online, and travel restrictions were imposed. These measures had a profound impact on how people in the U.S. went about their daily lives.
To understand the current and future impacts of the pandemic, we conducted a nationwide online survey. The goal of the survey is to capture attitudes and shifts in travel-related choices of people across the nation both during the pandemic and once COVID-19 is no longer a threat. The data are shared publicly in order to help government agencies and businesses prepare for the future. We are conducting additional survey waves with the same respondents to monitor how people’s choices evolve over the course of the pandemic and beyond.
An early version of the survey took place from April to June 2020, when the stay at home orders were in place in most parts of the country 3 , 4 ; this portion of the data collection is referenced as Wave 1 A . A slightly-modified larger-scale survey, Wave 1B ,was deployed between late June and October 2020. Subsequent survey waves are being conducted as the situation evolves. The collected data are released as they become available and necessary procedures for cleaning, documenting, and weighting the data are completed. This procedures for data processing are detailed in this paper. The present article focuses on data from the first wave of the survey.
In the months following the beginning of the spread of COVID-19, several efforts have been made to collect data related to COVID-19. In fact, many datasets have been compiled, specifically on COVID-19 testing 5 , medical imaging of COVID-19 cases 6 , the timeline of government interventions 7 , policy announcements 8 , implementation and relaxation of public health and social measures 9 , epidemiological data 10 , mobility-related data 11 , and out-of-home activity information 12 , to name a few. Researchers also turned to social media platforms, like Twitter and Instagram, to gather COVID-19-related data 13 , 14 , 15 , 16 . Furthermore, several surveys have been conducted to measure the impacts of the pandemic 17 , 18 , 19 , some of which are now released for public use 20 , 21 .
Our survey data are different from most others in several ways. First, it is comprehensive insofar as it includes data about a wide range of topics including commuting, daily travel, air travel, working from home, online learning, shopping, attitudes, risk perception, and socioeconomic and demographic details. Second, it captures detailed information about behaviors before and during the COVID-19 pandemic, as well as the choices that people expect to make when the COVID-19 virus is no longer a threat. Third, it was collected from respondents across the U.S., covering diverse socio-economic backgrounds, professions, education levels, and ages. Fourth, the survey is a true longitudinal panel survey, collecting data in multiple waves from the same individuals at regular intervals. Finally, the data are made publicly available to promote data-driven analysis and research.
The next section describes the data collection methodology, the questions included in the survey, the survey deployment process, and the participant recruitment strategy. Next, the data records section describes the data file types and metadata. Subsequently, the technical validation section explains the procedure for the survey data cleaning and weighting. Lastly, the final section provides additional notes for data users.
Ethical compliance
Our study protocol was approved by both Arizona State University (ASU) and University of Illinois at Chicago (UIC) Institutional Review Board offices. Participants were informed that their participation is voluntary, and that their responses are shared anonymously. An online informed consent was obtained from everyone who responded to the survey.
Survey questions
The data were collected through an extensive online survey with over 120 questions. The survey questions can be broadly divided into three categories: (1) retrospective questions focusing on the period before COVID-19, (2) questions about the period during COVID-19, and (3) prospective questions on respondent expectations for a future period in which COVID-19 is no longer a threat. The questions cover a wide variety of subjects including commuting habits, discretionary travel choices, work-related questions, study-related questions, shopping, dining, and so on – all before, during, and expected after the pandemic.
The survey questions can be classified into eight categories based on question subject type, namely: demographics, work, study, shopping and dining, transportation, and general attitudes. Table 1 describes each of these categories.
Survey recruitment
From April to mid-June 2020, initial Wave 1A responses were collected from a convenience sample via mailing lists, social media outreach, and mainstream media articles. A total of 1,110 responses were collected during this phase.
From late June onward, Wave 1B, the modified version of the survey, was deployed through survey invitations sent to a random email list purchased from a data marketing company. The list contained 350,000 email addresses belonging to people in 24 metropolitan areas across the U.S., as well as the state of Ohio (see Fig. 1 ). We purchased 100,000 additional email addresses of people randomly selected from across the country, including rural areas and excluding the areas covered by the first 350,000 emails. A total of 1,116 responses were received from the email list. Unfortunately, major email service providers quickly began marking our survey invitations as spam, while some smaller providers did not. While we took several steps to mitigate this issue, including changing the wording of the emails, changing the source of the emails (a uic.edu, asu.edu, or covidfuture.org email address), we were ultimately not able to fully solve this problem and saw a lower response rate from individuals with addresses from major email providers.

Distribution of survey respondents by the state of residence for survey dataset version 1.0. Alaska and Hawai’i are in the same weighting division as California, Oregon, and Washington.
Survey invitation emails were also sent to an additional list of approximately 39,000 email addresses from the Phoenix metropolitan area purchased for a previous survey effort 22 . This list yielded 782 responses. The survey invitation emails were sent using Amazon Web Services (AWS) and through the Qualtrics platform. Every 20 th respondent who was invited through the purchased email addresses received a $10 incentive as a gift card. Respondents also had the option to donate their survey incentive to a charity. Invitees received two reminders as part of efforts to maximize response rates.
An additional 5,250 responses to the Wave 1B survey were collected through a Qualtrics Online Panel. Qualtrics recruits these respondents from a variety of panels maintained by other firms and uses quota sampling to recruit respondents that are demographically representative of the nation. The Qualtrics quotas were set to collect information from 20 U.S. metropolitan areas, mostly consistent with the metropolitan areas sampled from the purchased email list, as well as the states of Ohio, Utah, North Carolina, upstate New York, and rural areas. In order to obtain samples that would represent the population in each of the selected geographies, quotas were imposed in the Qualtrics online panel subsample to guarantee representation based on income, age, race and ethnicity, and education. We requested all respondents to provide their email addresses in order to recontact them for subsequent survey waves. Since the Qualtrics respondents are professional survey takers, we designated most questions as mandatory, and we included attention check questions, which are shown to improve response quality 23 .
The distribution of responses by geography, as well as the targeted metropolitan areas, are shown in Fig. 1 . Figure 2 shows the distribution of responses by recruitment method, available in the “org” variable in the dataset. The geographical targets were chosen based on geographic and metropolitan area size diversity, as well as the state of the virus spread in May 2020.

Distribution of Record by Source (from the survey dataset version 1.0).
Figure 1 shows the distribution of survey respondents across the U.S. (50 states and the District of Columbia). Following our recruitment strategy, a greater number of responses come from larger and more urban states. Arizona is overrepresented due to the oversample of Arizona respondents in the email-based deployment. The respondents from the initial Wave 1A sample are also more likely to hail from Arizona as the Arizona State University survey team’s network is heavily Arizona-based. When the data are weighted, any geographic discrepancies at the census division level are controlled and overrepresentation of Arizona is controlled/corrected separately.
Additional survey waves
To monitor how people’s attitudes and behaviors evolve, survey respondents are contacted again with at least two shorter follow-up surveys, approximately four months apart in spring and fall 2021.
Data Records
The survey dataset 24 can be accessed from the ASU Dataverse at: https://doi.org/10.48349/ASU/QO7BTC . The dataset is available in CSV (comma-separated value) format. Since the data will be updated periodically, the data are versioned—in this article, results from the survey dataset version 1.0 are reported. The dataverse also contains the database codebook containing the metadata and explaining the variables. The codebook contains a changelog for each new version.
The respondents to Waves 1A and 1B received similar but not identical surveys. We have merged the responses to these two versions of the survey into the final dataset wherever possible. For some variables, the questions were identical, whereas for other variables, harmonization of similar responses was required. In the dataset, variables ending in ‘_harm’ are harmonized between the two datasets, variables ending in ‘_w1a’ are available only for Wave 1A respondents, variables ending in ‘_w1b’ are available only for respondents from our Qualtrics Online Panel, purchased email lists, and anyone who found the survey via the COVIDFuture web site or email lists after June 19, 2020 (start date of Wave 1B). Variables with no suffix were asked the same way between the two surveys, and no harmonization was necessary. We also provide a file containing only Wave 1B responses and variables, which simplifies analysis of the Wave 1B data.
Technical Validation
Data cleaning.
To monitor respondents’ attention to survey questions in the Qualtrics online panel, attention check questions were included. Respondents were allowed to miss one attention check and be given an opportunity to answer that section again. If they missed an attention check twice, or both attention checks once, their survey was terminated.
We additionally undertook several quality checks to help ensure that the collected data were valid. We removed any respondents who reported that they shop for groceries both in-store and online every day, or expect to after the pandemic, as these are likely to be invalid responses. We also removed respondents who reported strongly agreeing or strongly disagreeing with all COVID-related attitudes, as some of these were worded positively and some negatively. Several additional quality checks were undertaken in the Qualtrics Online Panel as part of Qualtrics’ data cleaning process, including a check for people finishing the survey too quickly.
Respondents that did not report a state of residence, reported living outside the 50 states and the District of Columbia, or did not provide answers to all of the control variables used in the data weighting process described in the next section were removed from the data. Due to this restriction, 558 records with missing control variable information, 59 records with missing home location, and one response from Puerto Rico were not included in the final dataset encompassing responses received through October 14, 2020. Further steps in data preparation will include imputation of missing data, which will allow for some of these omitted records to be recovered in the next version of the dataset. Among the respondents who were not included in the dataset due to missing control variable information, there are 34 respondents who declared their gender as Other; these respondents could not be included because the Census offers no control marginals to weight these records. Further data weighting procedures will attempt to incorporate non-binary gendered individuals on the dataset. Due to the data cleaning and filtering process applied to responses obtained through October 14, 2020, a total of 618 records were not included in the published dataset.
Data weighting
Because the raw data are not fully representative of the U.S. population, weights were calculated using the following control variables: age, education, gender, Hispanic status, household income, presence of children, and number of household vehicles. The weighting procedure accounts for the true population characteristics at the person level. Household-level variables (i.e., income, presence of children, and number of vehicles) were controlled at the person level as well. For example, the marginal distribution used for presence of children refers to the share of adults aged 18 years and older living in household with children, instead of the share of households that have children as it is usually represented. Those marginal distributions were computed using data from the Integrated Public Use Microdata Sample and the American Community Survey (ACS) 2018 1-year data 25 using the sample 18 and older in each of the weighting region boundaries. A noteworthy consequence of this approach is that adjusted household weights are necessary to evaluate household-level characteristics since individuals from larger households are more likely to be represented in the survey (given there are more individuals in these households), and thus have a higher probability of being selected. Weights for household-level analysis can be computed by dividing the person-level weight (provided in the data) by the number of adults in the household.
The national sample was divided into nine regions based on the reported home state (Table 2 ). Each region’s sample was then weighted to match the distributions observed in ACS 2018 1-year estimates 25 , meaning that the survey is demographically representative at the level of each region as well as the entire U.S. The unweighted and weighted survey results are shown in Table 3 ; the weighted results closely replicate population distributions, with inevitable minor deviations on variables that were not controlled in the weighting process.
Weights were calculated using iterative proportional fitting (IPF) procedures embedded within the synthetic population generator PopGen2.0 26 , 27 , 28 . Univariate marginal control distributions were derived from the Integrated Public Use Microdata Sample, American Community Survey (ACS) 2018 1-year data 25 .
Usage Notes
Since the survey will be followed by at least two follow-up survey waves, the database will be updated periodically after the data for each wave is collected, cleaned, and weighted. Each version of the data will be uploaded to the ASU Dataverse and assigned a new DOI number, and all previous versions will remain available to promote reproducibility.
The weights were developed to produce a sample that is representative of the U.S. population, as well as representative of nine divisions within the U.S.: eight census regions (with East and West South Central combined due to small samples in these regions), and a separate category for Arizona due to its large number of respondents. The weights are not guaranteed to produce a representative sample for other (smaller) geographies. When evaluating subsamples at a finer geography (e.g., state or metropolitan area), data users should compare marginal distributions of key demographic variables with the census, and re-weight the data if needed to be representative of the area being analyzed.
Some questions differ between Waves 1A and 1B. Therefore, we have weighted the dataset twice: once including all respondents (Waves 1A and 1B), and once excluding respondents to the Wave 1A sample. Data users should use the Wave 1B weights whenever using variables that are not present in the convenience sample. Since Wave 1A data deviates significantly in terms of population representativeness 4 , there are no weights for questions asked only of Wave 1A respondents. In the file with only Wave 1B responses, only Wave 1B weights are presented.
This unique dataset provides insights on attitudes and behaviors not just before and during pandemic, but also on what might be expected after the pandemic. Possible use cases include modeling of during-pandemic and longer-term changes in mode use, air travel, transit ridership, work from home, and traffic congestion (especially for peak period traffic planning). Published uses of this dataset are documented in Capasso da Silva et al . 29 , Chauhan et al . 30 , Mirtich et al . 31 , and Salon et al . 32 .
Code availability
No codes were developed for this research.
COVID-19 Map. Johns Hopkins Coronavirus Resource Center https://coronavirus.jhu.edu/map.html (2020).
CDC. Coronavirus Disease 2019 (COVID-19). Centers for Disease Control and Prevention https://www.cdc.gov/coronavirus/2019-ncov/prevent-getting-sick/social-distancing.html (2020).
Shamshiripour, A., Rahimi, E., Shabanpour, R. & Mohammadian, A. K. How is COVID-19 reshaping activity-travel behavior? Evidence from a comprehensive survey in Chicago. Transp. Res. Interdiscip. Perspect. 7 , 100216 (2020).
PubMed PubMed Central Google Scholar
Conway, M. W., Salon, D., da Silva, D. C. & Mirtich, L. How will the COVID-19 pandemic affect the future of urban life? Early evidence from highly-educated respondents in the United States. Urban Sci. 4 , 50 (2020).
Article Google Scholar
Hasell, J. et al . A cross-country database of COVID-19 testing. Sci. Data 7 , 1–7 (2020).
Kalkreuth, R. & Kaufmann, P. COVID-19: a survey on public medical imaging data resources. ArXiv Prepr. ArXiv200404569 (2020).
Desvars-Larrive, A. et al . A structured open dataset of government interventions in response to COVID-19. medRxiv (2020).
Cheng, C., Barceló, J., Hartnett, A. S., Kubinec, R. & Messerschmidt, L. Covid-19 government response event dataset (coronanet v. 1.0). Nat. Hum. Behav. 4 , 756–768 (2020).
Zheng, Q. et al . HIT-COVID, a global database tracking public health interventions to COVID-19. Sci. Data 7 , 1–8 (2020).
Xu, B. et al . Epidemiological data from the COVID-19 outbreak, real-time case information. Sci. Data 7 , 1–6 (2020).
Pepe, E. et al . COVID-19 outbreak response, a dataset to assess mobility changes in Italy following national lockdown. Sci. Data 7 , 1–7 (2020).
Killeen, B. D. et al . A County-level dataset for informing the United States’ response to COVID-19. ArXiv Prepr. ArXiv200400756 (2020).
Chen, E., Lerman, K. & Ferrara, E. Tracking social media discourse about the COVID-19 pandemic: Development of a public coronavirus Twitter data set. JMIR Public Health Surveill. 6 , e19273 (2020).
Zarei, K., Farahbakhsh, R., Crespi, N. & Tyson, G. A first Instagram dataset on COVID-19. ArXiv Prepr. ArXiv200412226 (2020).
Alqurashi, S., Alhindi, A. & Alanazi, E. Large arabic twitter dataset on covid-19. ArXiv Prepr. ArXiv200404315 (2020).
Lopez, C. E., Vasu, M. & Gallemore, C. Understanding the perception of COVID-19 policies by mining a multilanguage Twitter dataset. ArXiv Prepr. ArXiv200310359 (2020).
Gensler. US Work from home survey 2020. Gensler-US-Work-From-Home-Survey-2020-Briefing-1.pdf (2020).
Kleinberg, B., van der Vegt, I. & Mozes, M. Measuring emotions in the covid-19 real world worry dataset. ArXiv Prepr. ArXiv200404225 (2020).
Grashuis, J., Skevas, T. & Segovia, M. S. Grocery shopping preferences during the COVID-19 pandemic. Sustainability 12 , 5369 (2020).
Article CAS Google Scholar
Shuja, J., Alanazi, E., Alasmary, W. & Alashaikh, A. Covid-19 open source data sets: A comprehensive survey. Appl. Intell . 1–30 (2020).
Trung, T. et al . Dataset of Vietnamese student’s learning habits during COVID-19. Data Brief 105682 (2020).
Khoeini, S. et al . Attitudes Towards Emerging Mobility Options and Technologies – Phase 2: Pilot and Full Survey Deployment . https://tomnet-utc.engineering.asu.edu/wp-content/uploads/2020/11/TOMNET-Year-2-Project-Report-All-Universities_-Attitudes-Towards-Mobility-Options-Technologies.pdf (2019).
Shamon, H. & Berning, C. Attention check items and instructions in online surveys: Boon or bane for data quality? Surv. Res. Methods Forthcom . (2019).
Salon, D. et al . COVID Future Wave 1 Survey Data v1.0.0. ASU Library Research Data Repository https://doi.org/10.48349/ASU/QO7BTC (2020).
Ruggles, S. et al . IPUMS USA: Version 10.0 Minneapolis, MN: IPUMS https://doi.org/10.18128/D010.V10.0 (2020).
PopGen. MARG - Mobility Analytics Research Group https://www.mobilityanalytics.org/popgen.html (2020).
Ye, X., Konduri, K., Pendyala, R. M., Sana, B. & Waddell, P. A methodology to match distributions of both household and person attributes in the generation of synthetic populations. In 88th Annual Meeting of the Transportation Research Board, Washington, DC (2009).
Konduri, K. C., You, D., Garikapati, V. M. & Pendyala, R. M. Enhanced synthetic population generator that accommodates control variables at multiple geographic resolutions. Transp. Res. Rec. 2563 , 40–50 (2016).
Capasso da Silva, D. et al . How are attitudes toward COVID-19 associated with traveler behavior during the pandemic? Findings https://doi.org/10.32866/001c.24389 (2021).
Chauhan, R. S. et al . COVID-19 related attitudes and risk perceptions across urban, rural, and suburban areas in the United States. Findings https://doi.org/10.32866/001c.23714 (2021).
Mirtich, L. et al . How stable are transport-related attitudes over time? Findings https://doi.org/10.32866/001c.24556 (2021).
Salon, D. et al . The potential stickiness of pandemic-induced behavior changes in the United States. Proceedings of the National Academy of Sciences 118 (27), e2106499118, https://doi.org/10.1073/pnas.2106499118 (2021).
Download references
Acknowledgements
This research was supported in part by the National Science Foundation (NSF) RAPID program under grants no. 2030156 and 2029962 and by the Center for Teaching Old Models New Tricks (TOMNET), a University Transportation Center sponsored by the U.S. Department of Transportation through grant no. 69A3551747116, as well as by the Knowledge Exchange for Resilience at Arizona State University. This COVID-19 Working Group effort was also supported by the NSF-funded Social Science Extreme Events Research (SSEER) network and the CONVERGE facility at the Natural Hazards Center at the University of Colorado Boulder (NSF Award #1841338) and the NSF CAREER award under grant no. 155173. Any opinions, findings, and conclusions or recommendations expressed in this material are those of the authors and do not necessarily reflect the views of the funders.
Author information
Authors and affiliations.
Department of Civil, Materials, and Environmental Engineering, University of Illinois at Chicago, Chicago, IL, USA
Rishabh Singh Chauhan, Ali Shamshiripour, Ehsan Rahimi, Abolfazl (Kouros) Mohammadian & Sybil Derrible
School of Geographical Sciences and Urban Planning, Arizona State University, Tempe, AZ, USA
Matthew Wigginton Bhagat-Conway & Deborah Salon
School of Sustainable Engineering and the Built Environment, Arizona State University, Tempe, AZ, USA
Denise Capasso da Silva, Sara Khoeini & Ram Pendyala
You can also search for this author in PubMed Google Scholar
Contributions
R.P., A.M., S.D., D.S. and S.K. planned the project. D.S., M.C., D.C.S., R.C., E.R. and A.M. prepared the survey questions. M.C., D.C.S. and D.S. designed the survey flow logic. R.C., D.C.S., M.C., D.S. and S.D. deployed the survey. M.C. and D.C.S. performed data cleaning and survey data analysis. D.C.S. weighted the dataset. M.C. and D.S. worked on sending out the incentives to the selected respondents. R.C. prepared the first draft. All the authors made significant contributions to manuscript editing and approving the final version of the manuscript.
Corresponding author
Correspondence to Rishabh Singh Chauhan .
Ethics declarations
Competing interests.
The authors declare no competing interests.
Additional information
Publisher’s note Springer Nature remains neutral with regard to jurisdictional claims in published maps and institutional affiliations.
Rights and permissions
Open Access This article is licensed under a Creative Commons Attribution 4.0 International License, which permits use, sharing, adaptation, distribution and reproduction in any medium or format, as long as you give appropriate credit to the original author(s) and the source, provide a link to the Creative Commons license, and indicate if changes were made. The images or other third party material in this article are included in the article’s Creative Commons license, unless indicated otherwise in a credit line to the material. If material is not included in the article’s Creative Commons license and your intended use is not permitted by statutory regulation or exceeds the permitted use, you will need to obtain permission directly from the copyright holder. To view a copy of this license, visit http://creativecommons.org/licenses/by/4.0/ .
The Creative Commons Public Domain Dedication waiver http://creativecommons.org/publicdomain/zero/1.0/ applies to the metadata files associated with this article.
Reprints and permissions
About this article
Cite this article.
Chauhan, R.S., Bhagat-Conway, M.W., Capasso da Silva, D. et al. A database of travel-related behaviors and attitudes before, during, and after COVID-19 in the United States. Sci Data 8 , 245 (2021). https://doi.org/10.1038/s41597-021-01020-8
Download citation
Received : 14 December 2020
Accepted : 29 July 2021
Published : 23 September 2021
DOI : https://doi.org/10.1038/s41597-021-01020-8
Share this article
Anyone you share the following link with will be able to read this content:
Sorry, a shareable link is not currently available for this article.
Provided by the Springer Nature SharedIt content-sharing initiative
This article is cited by
Covid future panel survey: a unique public dataset documenting how u.s. residents’ travel-related choices changed during the covid-19 pandemic.
- R. S. Chauhan
- M. Bhagat-Conway
Transportation (2024)
Response willingness in consecutive travel surveys: an investigation based on the National Household Travel Survey using a sample selection model
- F. Atiyya Shaw
- Kari E. Watkins
Transportation (2023)
Tracking the state and behavior of people in response to COVID-19 through the fusion of multiple longitudinal data streams
- Mohamed Amine Bouzaghrane
- Hassan Obeid
- Joan Walker
Quick links
- Explore articles by subject
- Guide to authors
- Editorial policies
Sign up for the Nature Briefing newsletter — what matters in science, free to your inbox daily.

By Bastian Herre, Veronika Samborska and Max Roser
Tourism has massively increased in recent decades. Aviation has opened up travel from domestic to international. Before the COVID-19 pandemic, the number of international visits had more than doubled since 2000.
Tourism can be important for both the travelers and the people in the countries they visit.
For visitors, traveling can increase their understanding of and appreciation for people in other countries and their cultures.
And in many countries, many people rely on tourism for their income. In some, it is one of the largest industries.
But tourism also has externalities: it contributes to global carbon emissions and can encroach on local environments and cultures.
On this page, you can find data and visualizations on the history and current state of tourism across the world.
Interactive Charts on Tourism
Cite this work.
Our articles and data visualizations rely on work from many different people and organizations. When citing this topic page, please also cite the underlying data sources. This topic page can be cited as:
BibTeX citation
Open Data in tourism
How Open Data can sustainably improve the cooperation in tourism sector
Rising demand for new services
Every year millions of people flock to holiday areas to relax at the beach, explore nature or go sightseeing. The tourism industry has been experiencing a sustained boom for years and is continuously generating increased revenues in the holiday regions. Since digitisation does not stop at tourism, innovative solutions come into focus here as well. Data-driven services like apps and online communities are increasingly in demand and are frequently used for travel planning. However, a prerequisite for these services is the availability of data.
Benefits of Open Data
Published in June 2018 on the European Data Portal , the article The benefits of Open Data re-use are gaining awareness in tourism sector elaborates that the use of Open Data in tourism is predicted to have great potential. The availability of data and the openness of platforms in tourism were also discussed during the 11 th Tourism Camp in cooperation with the network Tourismuszukunft and outdooractive , with a particular focus on active cooperation. The aim was to create more transparency about existing industry projects. A panel of experts discussed how an Open Data infrastructure in tourism, based on a Linked Open Data (LOD) approach , can be implemented in the future to achieve sustainable digital transformation in tourism. Initiatives and approaches to standardise real-time data flow in tourism already exist at the European level. A project of the Salzburger Land Tourism Association already provides tourist information as Linked Open Data and stringently pursues the goal of building up knowledge graphs for tourism in other regions as well. These enable interoperability between the technical systems as well as hierarchy levels and thus enables the compatibility of different systems and collaboration of different actors in the tourism sector.
The time is ripe
The dissemination of standardised data will become even more important in the future and the tourism sector can benefit from it. The accessibility of data related to tourism offers the provision of information regarding region and location descriptions, tours or sights that can be read and processed by interfaces, databases and machines. The large IT companies like Google, Amazon, Facebook and Apple, who have an extensive understanding of data, already offer communication solutions in almost all areas - including tourism. Google, for example, provides the app Google trips where the user benefits from the extensive database of the search engine giant. With the user's consent to access his or her personal data in combination with existing data obtained by Google, the app analyses the mail traffic and the Google calendar so that flight data and destinations are available and additional journeys and offers can be suggested. In order to stay competitive smaller actors in the tourism sector are now realising that they have to share their data to offer tourists seamless and value-added services.
First steps into the future of Open Data in tourism
Open Data plays a key part in promoting the tourism sector. The company outdooractive manages many tourist data with the open central database solution . These include events, current news, region and place descriptions, tours and activity trail networks, accommodation reviews, excursion destinations and sights, and stories, pictures or videos.
With its app , outdooractive offers the user the possibility to plan a complete tour from start to end. Users of the app can become part of the community by publishing their own planned and recorded tours on the app's platform. This is only possible because of the complete synchronisation between the website and application.
This example illustrates initiated plans for the use of Open Data in tourism. If the tourism industry succeeds in organising itself jointly and building a comprehensive, open and interoperable data infrastructure, this could promote competition and innovation, enable new business models and reduce dependencies. More and more people are able to travel and are interested in such services, which is why innovative ideas within the tourism industry are far from being exhausted. For this reason, the industry should now start to move closer together and make use of synergy effects.
Let the journey begin!
quality-assurance
Quality Assurance (QA) for Open Travel Data (OPTD)
View the Project on GitHub opentraveldata/quality-assurance
- Quality Assurance (QA) for OpenTravelData (OPTD)

- Table of Content (ToC)
Ingest processors
Through a pre-built docker image, with a manually built docker image, through a local cloned git repository (without docker), pyenv and pipenv, launch the python checkers.
- Re-set the read-write property of indices
Simplified pipeline and index
Por full index and pipeline, optd consistency and geonames id, por having no geo-location in optd, city por not in optd, multi-city por in optd.
- OPTD vs IATA
State codes
Optd vs un/locode, airport bases / hubs, airline networks, airline appearing in schedules but not in optd, example - optd consistency and geonames.
Table of contents generated with markdown-toc
That repository features scripts to check the quality of the data files produced by the Open Travel Data (OPTD) project.
Though it is not well maintained, that project should produce a Quality Assurance (QA) dashboard, much like Geonames’ one . See the Geonames use case on the Data Quality reference page for more details.
For now, the results of the data quality checks are available on the Transport Search data QA page . For instance, for the 2 June 2021 snapshots:
- Results of the validation checks are published on: https://transport-search.org/data/optd/qa/2021-06-02/results/
- Corresponding reference data sets (which have been checked): https://transport-search.org/data/optd/qa/2021-06-02/to_be_checked/
The corresponding checkers are scripts, maintained in a dedicated checkers/ directory of this repository. Most of them are written in Python, but any other programmation language may be used.
And, hopefully, the QA dashboard will be powered by container images generated thanks to that repository as well.
Travis CI builds are partially covering the tests in https://travis-ci.com/opentraveldata/quality-assurance
Most of the scripts generate CSV data files, which can then be uploaded in databases (classical relational database systems (RDBMS) such as PostgreSQL or ElasticSearch (ES)), or served through standard Web applications. For historical reasons, some scripts may still generate JSON structures on the standard output. In the future, JSON should be used only for metadata, not for the data itself.
The CSV reports are published (thanks to Travis CI) to an OPTD-operated ElasticSearch (ES) cluster. The full details on how to setup that ES cluster, on Proxmox LXC containers, are given in a dedicated elasticsearch tutorial .
For convenience, most of the ES examples are demonstrated both on a local single-node installation ( e.g. , on a laptop) and on on the above-mentioned cluster.
- GitHub repository dedicated to Data Quality
- Transport Search data QA page
- Geonames use case on the Data Quality reference page
- Quality Assurance (QA) images on Docker Cloud
- Induction on monitoring with Elasticsearch
- How to set up a Python virtual environment
ElasticSearch (ES)
- EFK (ElasticSearch, Fluentd, Kibana
- Tutorial - Setup an ES cluster on Proxmox LXC containers )
- Elasticsearch geo-point
- Main: https://www.elastic.co/guide/en/elasticsearch/reference/current/ingest-processors.html
- Grok processor
- CSV processor
- Date processor
- Script processor
Quick starter
- Retrieve the Docker image: $ docker pull infrahelpers/optd-qa:latest
- Launch the Docker-powered scripts: $ docker run --rm -it infrahelpers/optd-qa:latest bash [ build@8ce25cc20a10 opentraveldata-qa ( master )] make checkers [ build@8ce25cc20a10 opentraveldata-qa ( master )] exit
Installation
- See the Dockerfile for more details
- Clone the OpenTravelData (OPTD) Quality Assurance (QA) Git repository : $ mkdir -p ~/dev/geo $ git clone https://github.com/opentraveldata/quality-assurance.git ~/dev/geo/opentraveldata-qa $ pushd ~/dev/geo/opentraveldata-qa $ ./mkLocalDir.sh $ popd
Points of Reference (POR)
- results/optd-qa-por-best-not-in-optd.csv , exhibiting the POR manually curated in the file of best known POR but not present in the generated OPTD public file
- results/optd-qa-por-cmp-geo-id.csv , reporting POR having a Geonames ID inconsistent among the curated file of best known POR and the generated OPTD public file
- Note that a CSV file has a single row, it is the header. So, it can be considered as empty. $ pushd ~/dev/geo/opentraveldata-qa $ pipenv run checkers/check-por-geo-id-in-optd.py $ wc -l results/optd-qa-por-best-not-in-optd.csv results/optd-qa-por-cmp-geo-id.csv 11 results/optd-qa-por-best-not-in-optd.csv 1 results/optd-qa-por-cmp-geo-id.csv $ ls -lFh results/optd-qa-por-best-not-in-optd.csv results/optd-qa-por-cmp-geo-id.csv -rw-r--r-- 1 user staff 400B Jan 10 15:54 results/optd-qa-por-best-not-in-optd.csv -rw-r--r-- 1 user staff 60B Jan 10 15:54 results/optd-qa-por-cmp-geo-id.csv $ popd
- results/optd-qa-por-optd-no-geocoord.csv , reporting the POR having no geo-location (geo-coordinates)
- Note that if a CSV file has a single row, it is the header. So, it can be considered as empty. $ pushd ~/dev/geo/opentraveldata-qa $ make results/optd-qa-por-optd-no-geocoord.csv pipenv run python checkers/check-por-optd-no-geocoord.py && \ wc -l results/optd-qa-por-optd-no-geocoord.csv && head -3 results/optd-qa-por-optd-no-geocoord.csv 1 results/optd-qa-por-optd-no-geocoord.csv iata_code^geo_id^loc_type $ popd
- results/optd-qa-por-city-not-in-optd.csv , reporting the POR in the curated file of best known POR with cities not referenced as a city in the generated OPTD public file
- Note that if a CSV file has a single row, it is the header. So, it can be considered as empty. $ pushd ~/dev/geo/opentraveldata-qa $ make results/optd-qa-por-city-not-in-optd.csv pipenv run python checkers/check-por-city-not-in-optd.py && \ wc -l results/optd-qa-por-city-not-in-optd.csv && head -3 results/optd-qa-por-city-not-in-optd.csv 1 results/optd-qa-por-city-not-in-optd.csv iata_code^optd_pk^loc_type^geo_id^city_code $ popd
- results/optd-qa-por-multi-city.csv , reporting POR with multiple cities
- results/optd-qa-por-multi-city-not-std.csv , reporting POR with multiple cities not following the sorting order of PageRank values
- Note that if a CSV file has a single row, it is the header. So, it can be considered as empty. ```bash $ pushd ~/dev/geo/opentraveldata-qa $ make results/optd-qa-por-multi-city.csv pipenv run python checkers/check-por-multiple-cities.py && wc -l results/optd-qa-por-multi-city.csv results/optd-qa-por-multi-city-not-std.csv && head -3 results/optd-qa-por-multi-city.csv results/optd-qa-por-multi-city-not-std.csv 111 results/optd-qa-por-multi-city.csv 30 results/optd-qa-por-multi-city-not-std.csv 141 total ==> results/optd-qa-por-multi-city.csv <== iata_code^optd_pk^loc_type^geo_id^city_code_list^page_rank ADJ^ADJ-A-250437^A^250437^AMM,ADJ^0.09819215728644931,0.0 AGY^AGY-R-10377026^R^10377026^MUC,AGY^0.35785165780444,0.0
==> results/optd-qa-por-multi-city-not-std.csv <== iata_code^optd_pk^loc_type^geo_id^city_code_list^page_rank BQC^BQC-B-11279243^B^11279243^BQC,YQB^0.006501240960634933,0.05835677851287664 BVV^BVV-A-8030061^A^8030061^BVV,ITU^0.0,0.006116247321847354 $ popd
The checker is the same as above ( checkers/check-por-cmp-optd-it.py )
- Check the number of POR having different state codes, broken down by country: $ awk -F '^' '{print $8}' results/optd-qa-state-optd-it-diff.csv|sort|uniq -c |sort -nr |head -5 342 CN 288 FR 185 DE 175 GB 138 RU $
- Check the number of POR having differrent state codes for a specific country: $ awk -F '^' '{if ($8 == "CN") {print $8 "^" $7 "^" $12}}' results/optd-qa-state-optd-it-diff.csv|sort|uniq -c |sort -nr |head -5 33 CN^^GD 24 CN^^NM 24 CN^^HB 19 CN^^ZJ 19 CN^^LN
- Add some exception rules in the optd_state_exceptions.csv CSV file : $ head -3 to_be_checked/optd_state_exceptions.csv pk^state_code^geo_id^source^env_id^date_from^date_to^wrong_state_code^comment AR-C^C^3433955^IR^^^^BA^State code in source does not reflect any of the known standards ( be it ISO 3166-2 or IATA codes ) , but seems to correspond to the phonetic initials. References: https://en.wikipedia.org/wiki/ISO_3166-2:AR, https://en.wikipedia.org/wiki/Provinces_of_Argentina AR-H^H^3861887^IR^^^^CH^State code in source does not reflect any of the known standards ( be it ISO 3166-2 or IATA codes ) , but seems to correspond to the first two letters of the state name. References: https://en.wikipedia.org/wiki/ISO_3166-2:AR, https://en.wikipedia.org/wiki/Provinces_of_Argentina
- results/optd-qa-por-optd-not-in-unlc.csv , exhibiting the POR referenced by OPTD but not by UN/LOCODE
- iresults/optd-qa-por-unlc-not-in-optd.csv , exhibiting the POR referenced by UN/LOCODE but not by OPTD
- Note that if a CSV file has a single row, it is the header. So, it can be considered as empty. $ pushd ~/dev/geo/opentraveldata-qa $ pipenv run checkers/check-por-cmp-optd-unlc.py $ wc -l results/optd-qa-por-unlc-not-in-optd.csv 10349 results/optd-qa-por-unlc-not-in-optd.csv $ ls -lFh results/optd-qa-por- * unlc * .csv -rw-r--r-- 1 user staff 4.7M Dec 13 18:22 results/optd-qa-por-optd-not-in-unlc.csv -rw-r--r-- 1 user staff 763K Dec 13 18:22 results/optd-qa-por-unlc-not-in-optd.csv $ popd
- In order to get the IATA-referenced POR out of UN/LOCODE-referenced ones: $ pushd ~/dev/geo/opentraveldata-qa $ awk -F '^' '{if ($2 != "") {print $0}}' results/optd-qa-por-unlc-not-in-optd.csv | wc -l 21 $ popd
That script checks, for every airline of the optd_airlines.csv file , that the airport bases/hubs are appearing in the optd_airline_por_rcld.csv file .
Note that both files ( optd_airlines.csv and optd_airline_por_rcld.csv ) will be downloaded from the OpenTravelData project and stored within the to_be_checked directory. If those files are too old, they should be removed (a newer version will then be automatically downloaded and stored again).
Note that a CSV file has a single row, it is the header. So, it can be considered as empty.
The following script displays all the missing airport bases/hubs:
If the script does not return anything, then the check (successfully) passes.
- That script performs, for every airline of the optd_airlines.csv file , some basic statistics on their network, modelled as graph (where POR are nodes and flight segments/legs are edges): $ pushd ~/dev/geo/opentraveldata-qa $ pipenv run checkers/check-airline-networks.py $ wc -l results/optd-qa-airline-network-far-nodes.csv 7 results/optd-qa-airline-network-far-nodes.csv $ ls -lFh results/optd-qa-airline- * .csv -rw-r--r-- 1 user staff 8.8K Dec 13 18:47 results/optd-qa-airline-network-far-nodes.csv -rw-r--r-- 1 user staff 34B Dec 13 18:47 results/optd-qa-airline-network-zero-distance.csv -rw-r--r-- 1 user staff 87B Dec 13 18:47 results/optd-qa-airline-network-zero-edges.csv -rw-r--r-- 1 user staff 70B Dec 13 18:47 results/optd-qa-airline-por-not-in-optd.csv -rw-r--r-- 1 user staff 136B Dec 13 18:47 results/optd-qa-airline-zero-coord-por-in-optd.csv $ cut -d '^' -f1 ,1 results/optd-qa-airline-network-far-nodes.csv | grep -v "^airline" 9W B5 KD NS P2 X3 $ cat results/optd-qa-airline-network-zero-edges.csv | grep -v "^airline" BY^MAN^MAN^1.0 MT^BHX^BHX^1.0 ZB^LBA^LBA^1.0 $ popd
- That script checks, for every airline appearing in the optd_airline_por_rcld.csv file , whether they are also referenced by OpenTravelData (OPTD) in the optd_airlines.csv file : $ pushd ~/dev/geo/opentraveldata-qa $ pipenv run check-airline-sched-in-optd.py $ wc -l results/optd-qa-airline-schd-not-in-optd.csv 28 results/optd-qa-airline-schd-not-in-optd.csv $ head -3 results/optd-qa-airline-schd-not-in-optd.csv airline_code 9Y AJA $ popd
Publishing to ElasticSearch (ES)
- Ingest the data: $ export TIMESTP = " $( date -u + '%Y-%m-%d %H:%M:%S' ) " $ tail -n +2 results/optd-qa-por-best-not-in-geo.csv | while IFS = ; read -r -a arr ; do curl -XPOST "http://localhost:9200/optd-qa-por-full-v1/_doc?pipeline=parse_optd_por_full_csv" -H "Content-Type: application/json" -d "{ \" tag \" : [ \" optd \" , \" qa \" , \" checker \" , \" por \" , \" geonames \" , \" check-por-geo-id-in-optd.py \" , \" optd-qa-por-best-not-in-geo.csv \" ], \" timestamp \" : \" ${ TIMESTP } \" , \" optd_qa_por_full \" : \" ${ arr [@] } \" }" ; done % Total % Received % Xferd Average Speed Time Time Time Current Dload Upload Total Spent Left Speed 100 660 100 186 100 474 1430 3646 -- : -- : -- -- : -- : -- -- : -- : -- 5076 % Total % Received % Xferd Average Speed Time Time Time Current Dload Upload Total Spent Left Speed 100 835 100 186 100 649 712 2486 -- : -- : -- -- : -- : -- -- : -- : -- 3199 { " _index " : " optd-qa-por-full-v1 " , " _type " : " _doc " , " _id " : " 8cSoKHEBu3P1TMMtzG4v " , " _version " : 1 , " result " : " created " , " _shards " : { " total " : 1 , " successful " : 1 , " failed " : 0 }, " _seq_no " : 1 , " _primary_term " : 1 } { " _index " : " optd-qa-por-full-v1 " , " _type " : " _doc " , " _id " : " 8sSoKHEBu3P1TMMtzG6f " , " _version " : 1 , " result " : " created " , " _shards " : { " total " : 1 , " successful " : 1 , " failed " : 0 }, " _seq_no " : 2 , " _primary_term " : 1 } $ export TIMESTP = " $( date -u + '%Y-%m-%d %H:%M:%S' ) " $ wc -l results/optd-qa-por-best-not-in-geo.csv 616 results/optd-qa-por-best-not-in-geo.csv $ ssh root@tiproxy8 -f -L9400 :10.30.2.191:9200 sleep 600 $ tail -n +2 results/optd-qa-por-best-not-in-geo.csv | while IFS = ; read -r -a arr ; do curl -XPOST "http://localhost:9400/optd-qa-por-full-v1/_doc?pipeline=parse_optd_por_full_csv" -H "Content-Type: application/json" -d "{ \" tag \" : [ \" optd \" , \" qa \" , \" checker \" , \" por \" , \" geonames \" , \" check-por-geo-id-in-optd.py \" , \" optd-qa-por-best-not-in-geo.csv \" ], \" timestamp \" : \" ${ TIMESTP } \" , \" optd_qa_por_full \" : \" ${ arr [@] } \" }" ; done % Total % Received % Xferd Average Speed Time Time Time Current Dload Upload Total Spent Left Speed 100 15053 100 8583 100 6470 128k 99538 -- :--:-- -- :--:-- -- :--:-- 226k { ... }
Querying ElasticSearch (ES) and Kibana
The ElasticSearch (ES) REST API is also the one to use for Kibana queries.
- Query: optd-qa-kibana-request-por-non-geo-hist-ctry.json query
- Response: optd-qa-kibana-response-por-non-geo-hist-ctry.json query

- Launch on the command-line the optd-qa-kibana-response-por-non-geo-map.json query : $ curl -XGET "http://localhost:9200/optd-qa-por-full-v1/_search" \ -H "Content-Type: application/json" \ --data "@elastic/optd-qa-kibana-request-por-non-geo-hist-ctry.json" | jq \ > elastic/optd-qa-kibana-response-por-non-geo-hist-ctry.json $ ssh root@tiproxy8 -f -L9400 :10.30.2.191:9200 sleep 5 ; \ curl -XGET "http://localhost:9400/optd-qa-por-full-v1/_search" \ -H "Content-Type: application/json" \ --data "@elastic/optd-qa-kibana-request-por-non-geo-hist-ctry.json" | jq \ > elastic/optd-qa-kibana-response-por-non-geo-hist-ctry.json
- It generates the optd-qa-kibana-response-por-non-geo-hist-ctry.json response
- Query: optd-qa-kibana-request-por-non-geo-map.json query
- Response: optd-qa-kibana-response-por-non-geo-map.json response

- Launch on the command-line the optd-qa-kibana-response-por-non-geo-map.json query : $ curl -XGET "http://localhost:9200/optd-qa-por-full-v1/_search" \ -H "Content-Type: application/json" \ --data "@elastic/optd-qa-kibana-request-por-non-geo.json" | jq \ > elastic/optd-qa-kibana-response-por-non-geo-map.json $ ssh root@tiproxy8 -f -L9400 :10.30.2.191:9200 sleep 5 ; \ curl -XGET "http://localhost:9400/optd-qa-por-full-v1/_search" \ -H "Content-Type: application/json" \ --data "@elastic/optd-qa-kibana-request-por-non-geo.json" | jq \ > elastic/optd-qa-kibana-response-por-non-geo-map.json
- It generates the optd-qa-kibana-response-por-non-geo-map.json response
Navigation Menu
Search code, repositories, users, issues, pull requests..., provide feedback.
We read every piece of feedback, and take your input very seriously.
Saved searches
Use saved searches to filter your results more quickly.
To see all available qualifiers, see our documentation .
- Notifications
Python wrapper around OpenTravelData (OPTD)
opentraveldata/python-opentraveldata
Folders and files, repository files navigation, opentraveldata (optd) data wrapper - python bindings.
Python wrapper around OpenTravelData (OPTD) data sets, for instance to be used by Python software needing to access OPTD data.
- PyPi artifacts: https://pypi.org/project/opentraveldata/
- Source code on GitHub: https://github.com/opentraveldata/opentraveldata
- Docker Cloud repository: https://cloud.docker.com/u/opentraveldata/repository/docker/opentraveldata/quality-assurance
- This Python-wrapper Git repository: https://github.com/opentraveldata/python-opentraveldata
- POR (Points of Reference)): https://www2.transport-search.org/data/optd/por/
- CI/CD deliveries: https://www2.transport-search.org/data/optd/cicd/
- Sourcce code on GitHub: https://github.com/opentraveldata/quality-assurance
- Quality Assurance (QA) reports: https://www2.transport-search.org/data/optd/qa/
- How-to install Python virtual environment with pyenv and pipenv
- How to package modules for Python
- PyPi Travis CI provider
- Launch a Python interpreter:
- Import the opentraveldata library:
- With the default local directory for the data files, that is /tmp/opentraveldata
- If you do not have access rights for writing into that directory, initialize the OpenTravelData object with a directory on which you have writing access rights:
- Display some information about the OpenTravelData object:
- For the main (IATA/ICAO) POR (points of reference) data file:
- For the UN/LOCODE POR (points of reference) data file:
- Download the latest data files (to be done once in a while; it takes a few seconds, depending on the network bandwidth):
- Trigger an exception if the data files have not been properly downloaded:
- Check that the data files have been properly downloaded, and that their sizes are as expected (40 to 50 MB for the IATA/ICAO data file and 4 to 5 MB for the UN/LOCODE data file):
- IATA/ICAO data file:
- UN/LOCODE data file:
- Display the first few lines (here, 3 lines) of the data files:
- Parse the data files and load their content into internal Python dictionaries:
- Retrieve the details for the IEV code:
Installation - configuration
Reference: How-to install Python virtual environment with pyenv and pipenv : https://github.com/machine-learning-helpers/induction-python/tree/master/installation/virtual-env
Install Pyenv, Python 3.9.6, pip and pipenv :
- Clone the Git repository and install the Python virtual environment (with pipenv ):
PyPi credentials for Travis deployment
- Encrypt the PyPi API token with the Travis command-line utility, which stores the encrypted secret token. As the project is managed by travis-ci.com , the --com option has to be added in the command-line:
Package and release the Python module
- Launch the setup.py script:
- Upload/release the Python packages onto the PyPi test repository :
- Upload/release the Python packages onto the PyPi repository :
Test the Python module
- Launch the test:
Contributors 4
- Python 96.4%
UN Tourism | Bringing the world closer
Statistics of tourism, tourism statistics database, share this content.
- Share this article on facebook
- Share this article on twitter
- Share this article on linkedin
UN Tourism systematically collects tourism statistics from countries and territories around the world in an extensive database that provides the most comprehensive repository of statistical information available on the tourism sector. This database consists mainly of more than 145 tourism indicators that are updated regularly. You can explore the data available through the UN Tourism database below:
145 Key Tourism Statistics
Data on inbound, outbound and domestic tourism, international tourism flows, tourism industries, employment and other indicators.
Economic Contribution and the SDGs
Data on the economic contribution of tourism and the implementation of relevant standards, such as the Tourism Satellite Account (TSA) and the System of Environmental-Economic Accounting (SEEA).
- About data.world
- Terms & Privacy
- © 2024 data.world, inc
OFFENER TOURISTISCHER DATENSTANDARD
DAS DATENFORMAT FÜR HÖCHSTE DATENQUALITÄT

EIN FORMAT - EIN VEREIN
LEISTUNGSSTARK. OFFEN. KOSTENFREI

OTDS - DATENSTANDARD DER TOURISMUSBRANCHE
BEI DER MEHRZAHL DER VERANSTALTER IMPLEMENTIERT
A high performance data standard is transforming the travel industry: The Open Travel Data Standard OTDS facilitates travel offers performing on highest data quality levels into the travel sales channels. The modern XML standard accelerates and specifies the production of travel offers while at the same time delivering significantly more booking relevant details and number of data records. The travellers benefit from a comprehensive and meaningful travel offer matching their search terms which in addition can be narrowed down to their individual whishes via filters. Last but not least reliable pricings and availability declarations ease the way to booking conversion.
- The OTDS standard
The OTDS association
OTDS stands for the Open Travel Data Standard – a powerful data format developed from experts within the travel industry to serve the branch. All interested market player may use the format and its extensive documentation free of charge.
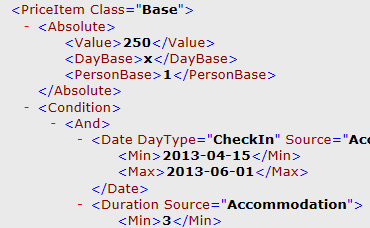
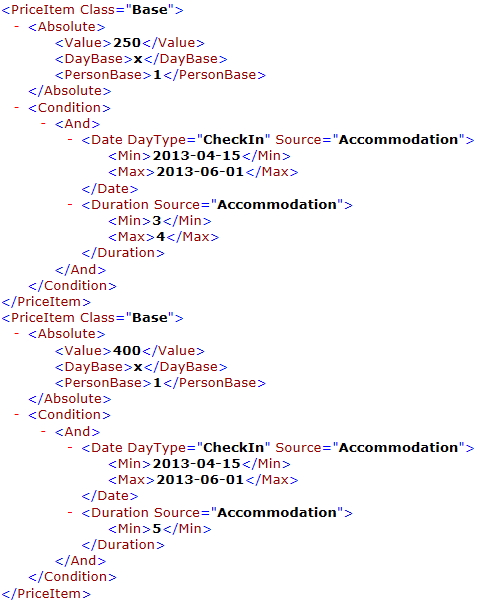
The XML-format OTDS contains all master data of the included travel components as well as all necessary product and pricing rules. Travel providers may use OTDS to distribute their offer into all sales channels, whether it be to travel agencies or to travel websites.
The Open Travel Data Standard OTDS is published by the OTDS association (OTDS e.V.) in Berlin, Germany. The members of the association represent almost every branch of the travel industry and join forces to continuously refine and extend the data format OTDS.
Via the committees of the association each member is actively involved in the decision-making process and into the development roadmap and realisation. The joint future development of OTDS and the communication between the members takes places within the exclusive internet-based member’s forum.
OTDS registration
Your Username *
Your Password * (min. 8 Characters)
Password repeat *
First name *
Last name *
Your eMail adress *
Hereby I accept the Privacy Policy
Privacy Policy
The OTDS association commits itself to compliance with the legal regulations for data security, which are regulated in particular in the Federal Data Protection Act (BDSG) and in the Telemedia Act (TMG).
In compliance with the laws BDSG and TMG the OTDS association collects and uses personal data of each user registering for downloading the OTDS standard.
The data entered by the user in this context are utilized by the OTDS association to create and maintain a user profile consisting of user name, a password chosen by the user which is being depicted only encrypted in our database, first and last name, e-mail address, and company. In addition date and time of the first registration and – for future logins – the date and time of the respectively last login is being archived.
By registering you declare your agreement with the OTDS association creating a personalized user profile within the scope of your registration for www.otds.de. You also declare your agreement with anonymized analyses of the entries within our database. Furthermore you declare your agreement with your e-mail address being used for sending you your login-confirmation and for contacting you in urgent matters concerning your OTDS-registration.
Link to external website
If you activate a link on www.otds.de leading to an external website, the external provider might obtain the information from your browser, which of our webpages was your origin before changing to his internet page. For the use of this data as well as for the content on those external websites exclusively the external provider is responsible.
Bitte lasse dieses Feld leer.
" style="background-color: #fff;border-color: #fff;color: #ea5c00;">
News & Events

freshcells joins the OTDS association
Since 2005, the software and consulting company freshcells systems engineering GmbH has been supporting many companies also in the travel industry in […]

Registrierung für den OTDS-Summit (6) geöffnet
Sorry, this entry is only available in Deutsch. Der OTDS-Verein freut sich sehr, die OTDS-Summit Reihe wieder aufzunehmen: In der 6. Auflage […]

OTDS honored for 10 years of DRV membership
At this year’s Annual General Assembly of Deutscher Reiseverband DRV in Berlin it became briefly ceremonial for the OTDS association: OTDS Chairman […]
THE OTDS STANDARD
What is the otds format capable of and what makes it so special, how does otds support tour operators and sales channels.
Strengths of OTDS - The data format OTDS is designed to improve the transmission of provider’s product data such as tour operators, airlines, rental car companies, or other supplier to the distribution systems that process those data for the use in travel search tools used in travel agencies or in travel website booking engines.

OTDS significantly minimizes the production time for data exports of tour operators or their Inventory Management Systems. Compared to the standards used to date such as INFX or KATI the production time is reduced by at least 75 percent. In addition incremental updates allow for deliveries of parts of the portfolio with the corresponding reduced file generation time.

Thanks to OTDS tour operators and other provider may decrease the volume of their data delivery to distribution systems significantly: In practice sizes for OTDS-files reach no more than 10% of the size for INFX-deliveries containng the same amount of offers. As with OTDS rather price- and product rules than complete offers are expressed, considerably more offers can be transferred in even smaller files. The effect on transfer- and loading times is correspondingly positive – while at the same time data quality is pushed to a higher level.

Due to the precise definition of price- and product rules by the tour operator in OTDS there is no scope for interpretation when processing the data. As a result the data quality increases – trips are displayed with reliably calculated prices and availabilities within the consulting tools of travel agencies and in the IBEs. Also total prices for families are feasible. In general with OTDS 95% of all prices are identical with those of the booking request. More that 90% of the trips are available and bookable.

Free of charge
OTDS as the open, nonproprietary standard is available free-of-charge and may be used by any tour operator- and distribution system – regardless of the technology deployed (e.g. central caches or local player). This ensures independence from proprietary data standards or -formats for tour operators and distribution systems.

OTDS already allows the transfer of all data for the most relevant travel components accommodation, flight, packaged travel as well as add-on services such as transfers, rental cars, insurances, activities, or parking lots. In addition OTDS contains all product- and price rules necessary for correct price calculation. All relevant information needed for product display, availability check, booking requests and the booking itself are also included.

OTDS is compatible for various systems: it is the powerful standard of choice for providing travel data to central cache systems as well as all filling players located in the sphere of the supplier. OTDS also supports different external attribution systems for describing the travel products such as Giata Facts and DRV GlobalTypes.
SEE THE OTDS STANDARD FOR YOURSELF
- The value of OTDS
- OTDS versions
The leading distribution systems in the German market already interpret and process OTDS. By doing so, the optimized data are available within their frontoffice tools for travel agencies as well as in their internet booking engines. The tour operator webpages also can be equipped with the enhanced OTDS-data, so that customers searching for travel offers in travel agencies or in the internet can rely on meaningful offers with reliable pricing and availability information and including add-on services. The OTDS format allows for significantly more details, options, room- and flight alternatives.
Families can rely on the total price of a trip when transmitted with OTDS from the very first display on. Price corrections resulting from booking requests are omitted thanks to reliable adult- and children prices and explicit rules for the price calculation in dynamically packaged travel offers.

„BEST TRAVEL TECHNOLOGY SOLUTION 2012“
The travel industry works with a large number of data formats. Those formats help to display the countless travel offers of tour operators and other provider that reach the consumer via various distribution channels. All information about a trip are being processed so that the IT systems within the distribution chain can depict those data. But the travel wishes of the consumer today are much more individual than ten years ago – the travel offers have to meet this change. And also tour operators and other supplier, online portals and travel agencies expect more from the technology they use. Legacy data formats today cannot fulfill those expectations anymore.
So far provider in the travel industry had to translate their travel offers into several data formats in order to supply the various distribution channels. In spite of the many formats the provider often did not succeed in highlighting their specific competitive advantages: the one format lacks a space for submitting taxi transfers, the other format cannot deal with child price reductions or specific child care offers.
So a new, common, open format was needed that delivers all relevant information regarding a travel offer into all distribution channels. This is precisely the intention of OTDS. At the same time it shall reflect the requirements of as many market player as possible and refine itself as an open data format. Thanks to the cost-free download at this website OTDS is freely accessible to all interested travel organisations and thus can establish itself as the future market standard.

OTDS versions - OTDS 1.0 was published by the OTDS association in April 2012. Within this first basic version the travel components accomodation, flight, packaged travel and add-on services such as transfer, rental car, parking, insurances etc. together with all the implicated product- and pricing rules already could be represented.
Version OTDS 1.9.3 provided comprehensive options for flight prioritisation and rules for rounding monetary amounts. Together with the multi-currency option and further diversified possibilities for rental cars and insurances those criteria meet the requirements of many tour operator regarding an efficient and extensive display of their travel products in the distribution systems.
With the main version 2.0, non-bookable content elements such as descriptive texts and media content as well as the ability for multilingualism were integrated. Thanks to the introduction of the Compare construct, product components can be combined much more flexibly under predefined conditions. The Accomodation-, Flight- and AddonWrapper allow the mapping of a sequence of flights and several hotels with rooms, meals and durations - an important basis for round trips in OTDS.
The current version OTDS 2.1 as new features among others offers a revision of the BookingNameSpace, introduces @Class to properties and extends the update option for tags.
OTDS in Use
A continuously rising number of provider from various areas of the travel industry use OTDS in order to fuel their travel offers to their customers quickly and reliably. Distribution channels and systems can feed on an extensive variety of travel offer data delivered in the up-to-date OTDS format for travel agency tools and Internet Booking Engines:
Schmetterling Technology

Schauinsland-Reisen

Bentour Reisen
Attika Reisen
Testimonials.
“OTDS: a flexible and living standard, that optimally displays the enormous product diversity of dozens of WBS-tour operators – without converter or third parties. Highest performance in terms of quality and quantity!”
“OTDS is just fun”

“OTDS offers unlimited possibilities for travel offers and overcomes the limitations of other formats.”

Hotel-only, Package travel and flight data in OTDS
Among others the following provider deliver their portfolio of offers in OTDS already or provide it via an OTDS-Player.
"Entire offering" includes the hotel-only, package- and X-offerings of a tour operator brand. The list does not claim to be complete.
- 5 vor Flug (live in Amadeus, Schmetterling and Traffics)
- Aldiana (live in Amadeus, Schmetterling and Traffics)
- Alltours (entire offering live in Amadeus, Schmetterling and Traffics)
- Anex (Hotel-only and packaged trips live in Amadeus, Schmetterling and Traffics)
- anixe (bedbank, Hotel-only data-delivery)
- Attika Reisen (Hotel-only and packaged trips live in Amadeus)
- Bentour Reisen (entire offering live in Amadeus, Schmetterling and Traffics)
- BigXtra (entire offering live in Amadeus, Schmetterling and Traffics, corporate website IBE with OTDS-data)
- Botros Tours (entire offering in the OTDS-Player)
- Bucher Reisen (entire offering live in Amadeus, Schmetterling and Traffics)
- byebye (entire offering live in Amadeus, Schmetterling and Traffics)
- Connected Destination (Hotel-only and packaged trips live in Traffics)
- Coral Travel (entire offering live in Amadeus, Schmetterling and Traffics)
- DERTOUR (entire offering live in Amadeus, Schmetterling and Traffics)
- dta Touristik (Hotel-only and packaged trips live in Amadeus)
- ETI (entire offering live in Amadeus, Schmetterling and Traffics)
- ECCO-Reisen (entire offering live in Amadeus)
- FTI Touristik (entire offering live in Amadeus, Schmetterling and Traffics as well as available in OTDS-Player)
- Gruber Reisen (entire offering in OTDS-Player, live in Amadeus)
- Helvetic Tours (Hotel-only and packaged trips live in Amadeus, Schmetterling and Traffics)
- ITS, ITS Billa und ITS Coop (entire offering live in Amadeus, Schmetterling and Traffics)
- Jahn (entire offering live in Amadeus, Schmetterling and Traffics)
- Kuoni (entire offering live in Amadeus, Schmetterling and Traffics)
- Luxair Tours (entire offering live in Amadeus)
- Meiers Weltreisen (entire offering live in Amadeus, Schmetterling and Traffics)
- Misir (entire offering in OTDS-Player)
- Neckermann Reisen (entire offering live in Amadeus, Schmetterling and Traffics)
- Öger Tours (entire offering live in Amadeus, Schmetterling and Traffics)
- Olimar (entire offering live in Amadeus, Schmetterling and Traffics, OTDS for website)
- Palma (Hotel-only and Packaged trips live in Traffics)
- Phoenix (Hotel-only and Packaged trips live in Amadeus)
- Schauinsland-Reisen (entire offering live in Amadeus, Schmetterling and Traffics, offering available in OTDS-Player)
- Sonnenklar-TV (Hotel-only and packaged trips live in Amadeus and Traffics)
- Travel Partner (Hotel-only also in combination with Addon-Services in various channels)
- TUI (TUI Germany/Switzerland, Airtours DE/CH, XTUI: entire offering live in Amadeus, Schmetterling and Traffics)
- TUI Cruises (offering available in OTDS-Player and on TUI Cruises website)
- Urlaubstouristik (entire offering live in Amadeus)
- vtours (VTOI live in Traffics)
- Windrose Finest Travel (Hotel-only and packaged trips live in Amadeus and Schmetterling)
Flight content in the OTDS format is provided by the travel technology solution providers of Bewotec via its Flex Flight Player (click here for Bewotec airline list ) and Ypsilon.net (click here for Ypsilon airline list ).
OTDS Association
The “Verein zur Förderung eines offenen touristischen Datenstandards e.V.” (Association to promote an Open Travel Data Standard, OTDS e.V. in Berlin, Germany) specifies and develops the data format OTDS for the travel industry. OTDS is based on open, nondiscriminatory, and standardized technologies. The data format is freely available and free-of-charge to everyone, especially to enterprises within the travel industry – regardless of a membership within the OTDS e.V.
OTDS – a modern data standard
It is the objective of the OTDS e.V. to establish its state-of-the-art data format OTDS as a market-wide standard for transmitting all product data relevant for distribution between provider/tour operators and distribution systems. The format is open and non-proprietary. OTDS is independent from any technology concepts and can be used with central caching systems as well as with decentralized player-hub solutions.
Constitution
The OTDS e.V. constitution can be downloaded here.
The constitution defines the objective of the association, explains the membership-status with its privileges and duties, describes the institutions within the organisation as well as their tasks, and lists further regulations.
The OTDS association as of today has 31 members. They represent almost all areas of the travel industry as well as several markets: tour operators, supplier, touristic distribution systems, travel technology supplier, and associations. The OTDS e.V. offers members comprehensive support for their implementation of the data standard as well as the opportunity to actively promote the development of the format by becoming active in the OTDS member forum. Here, the extensive Thematic Specification, which - unlike the Technical Specification - is reserved only for the members of the Association, is also stored.
You may request extensive information on the membership in the form below.
The member companies include:

As an open data standard, OTDS advances the entire travel industry and is not limited to the members of the OTDS association. Companies that want to support this common approach for a powerful, flexible travel data standard can now also do so as promoters of the OTDS association.
You may request extensive information on becoming a promoter in the form below.
The Board of Directors
The executive committee is the leading organ of OTDS e.V. and is elected by the members for three years. In the election in June 2023 Ömer Karaca (Schmetterling) was elected Chairman of the Board. Vice Chairmen are Michael Becher (Bewotec) and Deniz Ugur (Bentour). Michael Fischerkeller (vtours), Haiko Gerdes (TraSo), Thorsten Hendricks (Schauinsland-Reisen), and Lothar Schmitz (Amadeus Leisure IT) complete the Board of Directors.

OTDS Association – 8 good reasons for membership
- Active participation in the further development of OTDS
- Personal contacts for support and questions
- Exclusive access to the extensive Thematic specification
- Introduce your own requirements
- Influence on the development of the association
- Information and exchange in the OTDS member forum
- Image effects and public impact
- The ideal factor
Become a Member or Supporter
Here you can request non-binding information about a membership or on becoming a supporter:
Your name *
Your eMail address *
Your message *
If you have any questions regarding OTDS, the OTDS association or if you are interested in a membership or in becoming a supporter, please contact us via the contact form.
You can request access to OTDS schema definition and OTDS documentation here.
You can request information about the membership and the OTDS association itself here.
OTDS e.V. Lietzenburger Straße 99 10707 Berlin, Germany
Fon: +49 (0) 30 284 06 29 Fax: +49 (0) 30 284 06 30
Your message
- Knowledge Hub
- Product Status

Find a Data Set
- Browse All Data Sets
- Global Airline Schedules Data
- Flight Status Data
- Historical Flight Data
- Flight Seats Data
- Flight Emissions Data
- Minimum Connection Times
- Master Data
- Passenger Booking Data
- Global Flight Connections Data
- Airfare Data
How we deliver data
- Data Delivery
- Latest Product Updates
Data Suppliers
- Share your data
Try our Data
Flight data sets.
The world's most accurate and information-rich flight data
ANALYTICS PLATFORM
- Analyser Analytics Platform
EXPLORE ANALYSER MODULES
- Connections
DEMO ANALYSER PLATFORM
Powerful aviation analysis platform to drive commercial and operational decision making across the industry.
WE POWER THE AIR TRAVEL ECOSYSTEM
- Consultancies
- Governments & Security
- Travel Technology
- Airport Service Providers
TRUSTED BY LEADING ORGANISATIONS
Air Black Box
- View All Case Studies
Springshot: Minimizing delays with OAG's Status Data
- All Blogs, Webinars & Podcasts
- Covid-19 Recovery
- Future of Travel
- Aviation Market Analysis
- Aviation Sustainability
- Data, Technology & Product
- Where To Meet Us
- Monthly Live Webinars
- Travel Recovery Tracker
- Busiest Flight Routes in the World
- Busiest Airports in the World
- Airline Frequency and Capacity Statistics
- Monthly OTP Analysis
- Middle East Market Analysis
- US Aviation Market Analysis
- South East Asia Market Analysis
- China Aviation Market Analysis
- View All Analysis
US AVIATION MARKET ANALYSIS
Discover the busiest airports, airlines and flight routes in the US this month.
OUR COMPANY
- Diversity & Inclusion
- OAG & The Environment
- Our Locations
- What's New At OAG
GET IN TOUCH
- Press Office
Explore a career at OAG. See the latest job openings here.
POWERING FRICTIONLESS TRAVEL IN A DATA-DRIVEN WORLD
The leading data platform for the global travel industry.
Powering growth and innovation with frictionless access to high-quality travel data.
DATA AND INSIGHT
Our versatile platform provides businesses with the data they need, whenever they need it. Finding new revenue streams, driving growth across operations and deepening relationships with customers.
THE DNA OF TRAVEL
Aviation and travel has been in our DNA for a century. We offer customers the ability to understand movement of people and goods and view data points related to those journeys.
FRICTIONLESS ACCESS
Seamless integration is critical, particularly for an industry with a complex legacy technology landscape. Our cloud delivered, API- connected systems complement the technological needs of any customer.
FEATURED DATA SETS
The world’s most accurate and information-rich flight data
GLOBAL AIRLINE SCHEDULES
The most accurate airline schedules database on the market, giving you access to commercial airline schedules, aircraft configurations, flight connections, minimum connection times and flight schedule changes.
FLIGHT STATUS DATA
Tracking thousands of flights, cancellations, and status changes every day to bring you a comprehensive feed of the most accurate flight status data.
HISTORICAL FLIGHT DATA
Analyze airline, airport and route performance with our unique archive of historical flight information and performance data to drive your internal and competitive benchmarking, as well as future strategy and innovation.
ELEVATING THE IN-FLIGHT EXPERIENCE THROUGH INNOVATION
Discover how today's in-flight entertainment technologies are not just about entertainment but enhancing overall journey assistance and offering personalized retail opportunities.
With our airline data create precise insights through quality feeds and analytics to inform your route development, react to trends and predict market changes.
CONSULTANCIES
Create award-winning strategies and provide actionable market insight with the most comprehensive aviation database.
Detect indicators, recognize potential risk, assess revenue, and forecast market performance with insight into future flights and historical patterns.
GOVERNMENT & SECURITY
Understand potential risk and improve border performance with critical airport data intelligence to fuel your operational and personnel strategies.
TRAVEL TECH
Power systems and applications across the whole travel ecosystem, including Big Tech, Metasearch, OTAs, Start Ups, Booking Apps and much more.
AIRPORT & TRAVELER SERVICES
Expand your airports reach, spot commercial opportunities and improve your customer experience by reacting early to disruption and alerting passengers with OAG's travel data.
TRUSTED BY THE BEST
Put your business in good company

We knew we needed an accurate and reliable source of real time flight data… we’re confident that OAG is the right partner.
Without OAG, we wouldn't have the right data, the right pricing or the right risk model for our insurance partners. Without OAG, there's no business.
We came to OAG because they were responsive, informative, reliable and technically superior -which made integration easy.
Global Pilot Source
Flight Information API has allowed Air Black Box to completely automate the process of building schedules, while dramatically improving their accuracy.
US AVIATION MARKET LATEST INSIGHTS
Discover the busiest airlines, airports and most popular flight routes in the United States this month. View the extensive aviation data - including states adding the most capacity - plus expert analysis.
TECHNOLOGY PARTNERS
In partnership with leading technology developers we create powerful solutions you can count on, with the flexibility to scale and grow with your needs.

- Download Specs
- Download Code List
OpenTravel High Level Strategy for 2023 and beyond
API costs have become a major issue in the travel industry. The move to APIs that started 20 years ago has changed the travel market. It initially lowered connection costs and made direct connects between travel providers and channels more flexible. However, the move away from the rigor of older protocols has led to wide differences in how messages work. In addition, XML messages were created to do the same as the older messages. The processing flow didn’t change, so in most cases the legacy systems were not changed and various types of front ends (hubs, portals, gateways, etc.) translate to XML and back. This wrapping approach does not work very well now that all want to move to JSON/REST type connections, and these newer architectures work very differently. As a result, the current effort to jam JSON into existing process flows and front ends is having poor results.
This has all led to a lot of API chaos, meaning high labor costs and exceedingly long cycle times to market. The chaos refers to the large variations in how the newer APIs work and how the API producer decided to overcome the issues mentioned above. Fairly unique to the travel industry, the larger cost factor is not for the API producer, for which there are continuously improving tools, but for the API consumer. To get much of anything done in travel, you need to interoperate with others. This means everyone is hit with the problem of dealing with hundreds to thousands of APIs that do the same basic business functions but work differently. The resulting cost is a major factor in preventing travel retail from catching up to the digital capabilities of other industries.
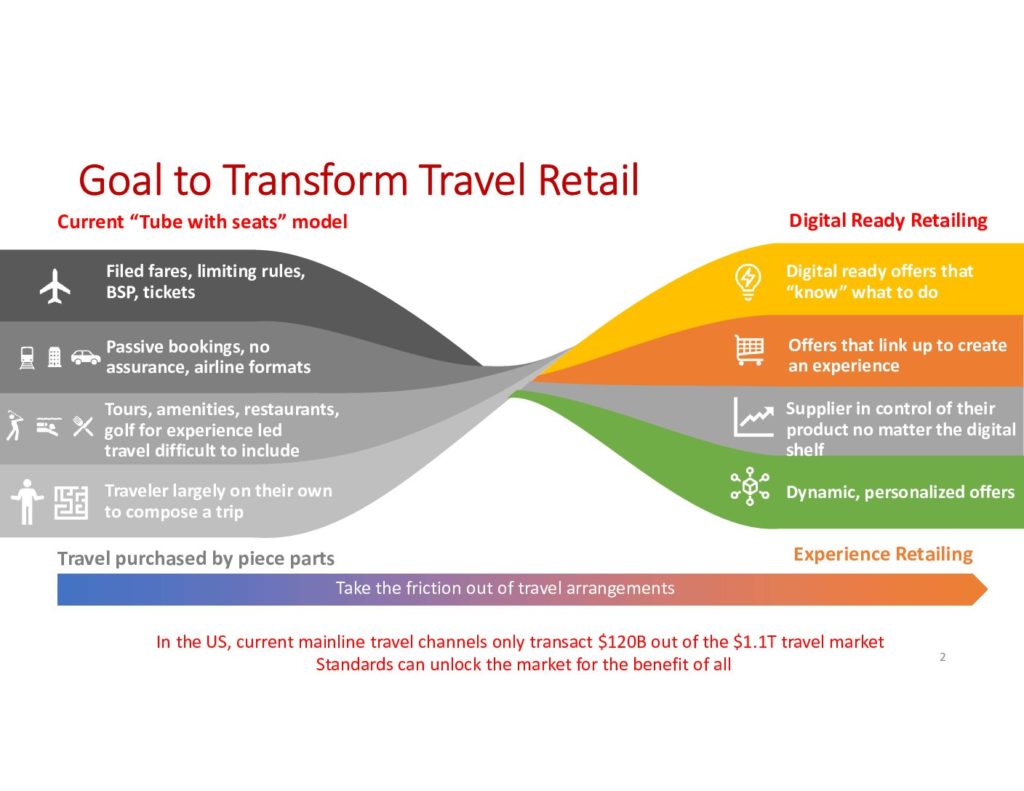
The number of APIs encountered to do a simple trip quickly explodes. The issue is not the product, price or rules themselves, it’s how they are presented in the API.
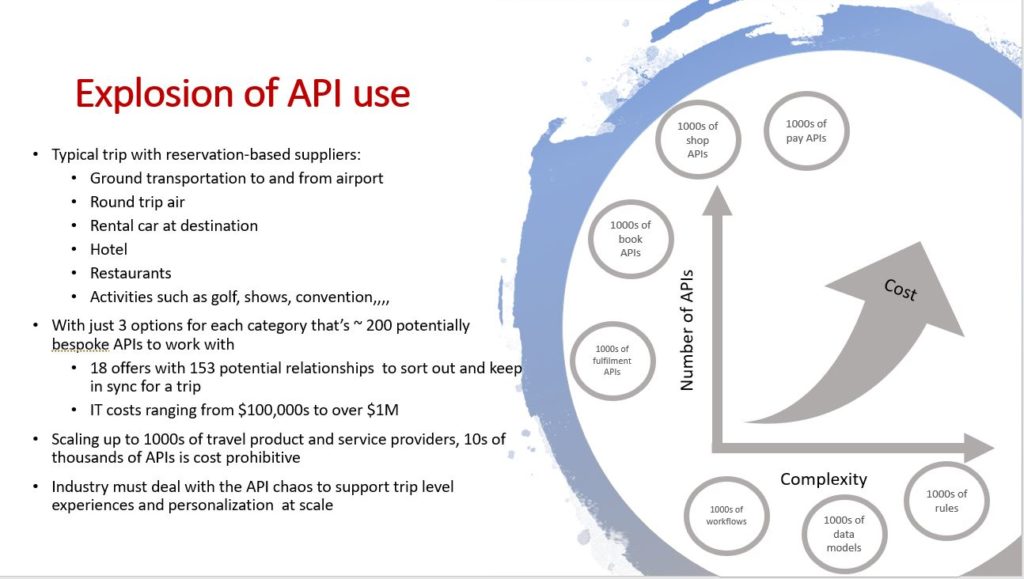
To deal with this complicated problem in a sustainable way requires cooperation between the participants in travel retail. To support this cooperation, OpenTravel must change.
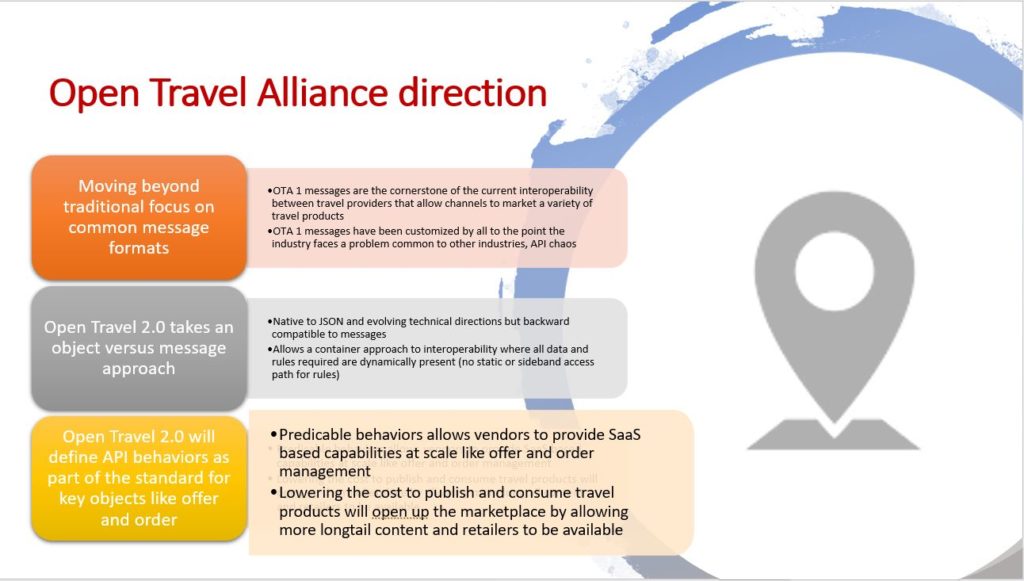
Now let’s look at how this would work. More standards are not necessarily the answer. Developers today need an example that shows them how something works and how they can copy it. This is called reference implementations. For travel, this would be end-to-end examples of common API functions and workflows. They would show best practices of API sequence, documentation, security handling, parameter passing, call backs for data like rules and so much more. All things that don’t affect or limit product team innovation to achieve market advantages. As important as API behaviors is a common understanding of the data as business objects. This may be referred to as a common data model, but it’s better to refer to it as a common syntax where not only is the data format defined, but so is the context of what the data means and what the data can do. This already exists in OpenTravel 2.0, referred to in the charts as the common model. This is all pulled together in a community sandbox.
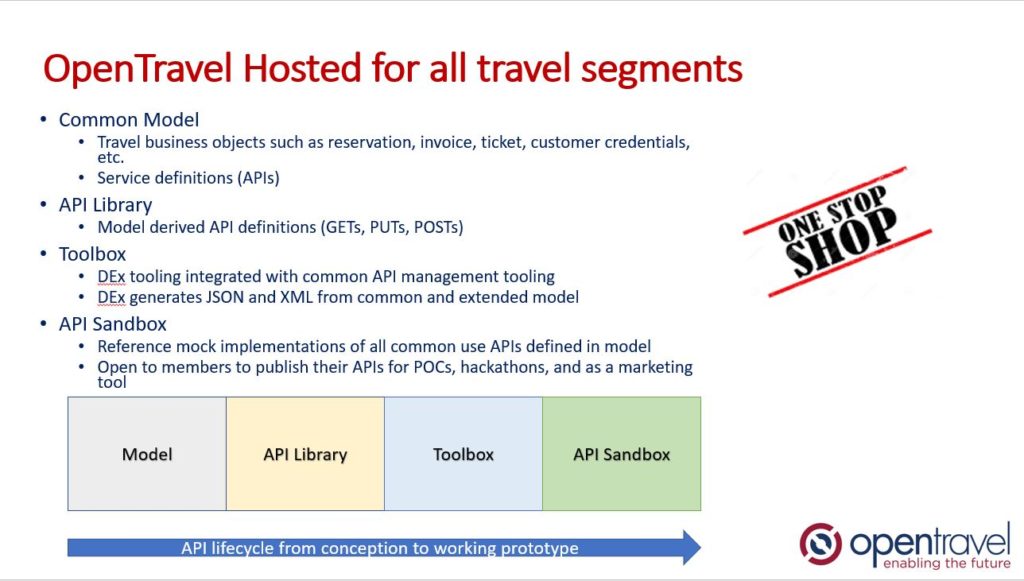
The sandbox provides a focal point for travel industry standards bodies and trade associations. They drive the business and market direction on behalf of their members. OpenTravel shows the technical side: how to do what they want in a more consistent way across travel sectors.
You may be thinking that it will never work because these other groups will not agree on everything, but the good news is that they don’t need to. It’s OK for there to be differences between sectors or even individual providers. The critical part is that we all agree on how and where those differences are documented (documentation means in a machine-readable way like XML or JSON). Not to be used in a message but for tooling to automate handling differences. Hence the major travel industry standards bodies and trade associations can drive a common model and API practices.
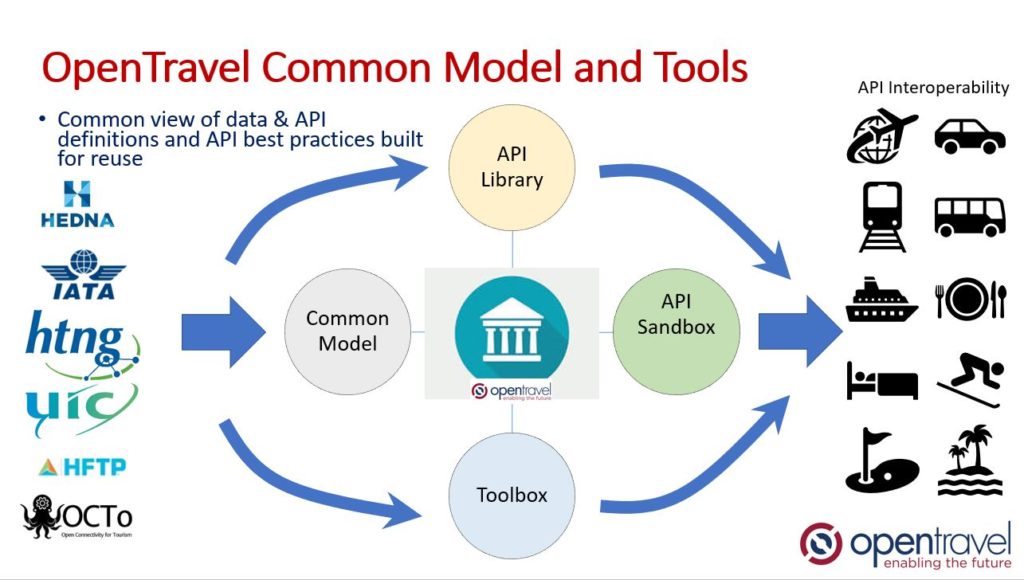
What had been discussed to this point is how we get to a common data model providing syntax across travel sectors. Differences such as how an air order works versus a hotel is provided for. These differences are easily understood, and in many cases, the handling can be automated. There is still a need for differences between providers in the same sector. Part of that need is already handled in the OpenTravel common model. The common model holds all data information the community has deemed important. For each API generated, one may select from the model only what is needed for that API. If IHG wants a different combination of data than Hilton, that’s easily handled in the tooling provided.
However, what remains is the extensions to the model that the community does not deem suitable for common use. Examples include the extensions that are needed to deal with a specific legacy backends (PMS. CRS, GDS, etc.). Some providers may make extensions they feel are a competitive value. Today these extensions are invisible behind the firewall of providers. Retail partners only see them when they provide documentation and are eventually allowed access through the firewall. This effort itself, to provide documentation and allow access, is expensive.
The alternative is to provide a service in the OpenTravel common model for private extensions. Consider a scenario where I am a commuter airline or app developer startup that wants to direct book with a hotel provider. I can see what is in the common model for hotels, but it does not provide all the necessary information needed to work with this hotel company. They provide me access to their extensions hosted in the same site and sandbox where the common model is. Now I know all I need is to connect. Further, I can mock test all APIs without bothering the dev and security teams at the hotel. Once testing is done and commercial agreements are in place, then the effort moves into acceptance testing requiring firewall access. The hotel company has deferred nearly all costs until they can witness via a POC that the potential partner can deliver. Note this also acts as a means for the hotel company to distribute API updates. API consumers can pick up the changes and test when they are ready. Also note that access to a real test system at the hotel can be set up thru the sandbox. This further reduces impact on hotel dev and security teams as the needed infrastructure is in place and reusable.

What follows is a similar diagram to one before showing the standards bodies and trade associations. What’s different is the direct participation of the API providers as they can extend the model as needed to support real world scenarios that are implementable.

We’re in the home stretch of the strategy. This publication mostly talks about the first phase of modernizing travel retail via cooperation. Further steps are enabled by phase one. A big step is to move into offer and order management that is totally cloud based. We’re not talking about an individual provider or channel using the cloud for caching. This will be more expansive and cooperative to provide sub second response time around the globe. Next, or in parallel, would be the exploitation of AI/ML. Use of AI/ML is still fairly limited to specific use cases like sorting out which fares are worth calculating for air availability calls. Some are working on use of AI/ML to support personalization. However, the latter is limited to private channels and not at a trip level. Not at scale anyway. The issue is lack of reliable data and cross provider/channel identity management. The first phase of cooperation thru OpenTravel provides a foundation these and many more issues.

API chaos is costing the travel industry large amounts of money, adds time to deployment, and is getting worse with the moves to JSON/REST. The chaos locks a lot of travel content out of the market as it is too expensive to connect. There is a large impact on the extension of AI/ML solutions for travel retail, because of poor data quality. This is directly due to the lack of a common understanding of data syntax. This can only be resolved as a community. Keep in mind not everyone needs to agree on the meaning of every data element. What is needed is to agree to disagree, and to document in a common way what the differences are.
Investing is OpenTravel is not a payment for messages and a model anyone can download anyway. Investing in OpenTravel is about opportunity for cost avoidance and revenue enhancement far greater than the investment. OpenTravel was founded because it was far cheaper to work together to define XML messages than do it individually. The same is true for APIs today. It will be far cheaper to deploy and consume APIs if the industry players cooperate on the noncompetitive aspects of how APIs work. Lowering API costs would unlock immense amounts of travel content and allow AI/ML technology to live up to the hype. Please support the OpenTravel mission. It makes business sense to do so.
If you want to get the pdf file, click here .
- Specifications
- Current Events
- Announcements
- Download OTM Tool
Follow Us On:
- Log in/Sign up
Castillo Travel Agency LLC
- 3225 WOODLAND PARK DR APT 512
- Castillo Travel Agency LLC (trading name, 2024-04-17 - )
Recent filings for Castillo Travel Agency LLC
Latest events, corporate grouping user contributed, identifiers.
Problem/question about this data? Click here
For access please Log in / Sign up
Money latest: These are the most in-demand holiday destinations this year
Welcome back to our Money blog, where we bring you all the latest consumer and personal finance news and tips. This week we're kicking off by talking about holidays (seeing as the sun has finally come out), and we're answering a reader's Money Problem on an undeclared management fee.
Monday 6 May 2024 12:32, UK
- The most in-demand holiday destinations this year
- Interest rates, inflation and fuel prices: What you need to know about economy this week
- Money Problem: My daughter discovered undeclared £600 management fee after buying her flat - can we complain?
Essential reads
- GoFundMe and loan sharks: How Britain's poorest are burying their loved ones in 2024
- Cinema first is back - so should movie lovers unsubscribe?
- 10 biggest mistakes people make in job interviews I Tell us your job interview mistakes/stories/tips in the comments box
- State pensions 'could be in doubt for future generations'
- New ISA rules were supposed to help savers - they've just made everything more complicated
- Train strikes in May - everything you need to know
Ask a question or make a comment
By Emily Mee , Money team
Scroll through GoFundMe and it won't be long before you see them.
There's a widow left with her husband's financial struggles. Three young siblings trying to raise funds for their mum's send-off after her sudden death. A 25-year-old domestic violence victim whose family want to give her the send-off she deserves.
There are scores of pages like this as an apparently increasing number of Britons struggle with funeral costs.
These costs have risen 126% in the last two decades, according to a recent report from SunLife.
Where families would once have paid £1,835 for a basic funeral, they are now looking at costs of £4,141 on average.
"People can't afford to bury their dead," says Pastor Mick Fleming, who runs the charity Church On The Street.
He frequently spends his time helping families pay for funerals and providing his services as a minister for free, although he says there is simply too much demand for his small charity to help everyone.
Government or local authority grants are available to help families with funeral costs, but Pastor Mick says these can come too late as undertakers will often require a partial payment upfront.
There's an even darker side to this, too.
"What we're now seeing is people who are poor can't walk into the bank and get a bank loan - the economy's tough at the minute," Pastor Mick says.
"They can't get legitimate access to money so they can't borrow it and pay a decent standard rate back, so they have to go to loan sharks."
Many then find it impossible to pay the loan back and face threats from the criminals who lent them the money, says Pastor Mick.
He recalls: "There was a middle-aged lady, she had to borrow the money to bury her son.
"She couldn't pay the money back so then she started to get threatened and intimidated. People turning up at the house.
"It was pretty horrendous. She was getting suicidal. She was heartbroken already and she just couldn't get the money together."
The pastor says he was able to negotiate on her behalf - something he is now having to do as part of his charity work - but "you can't do that for everybody".
A funeral without a service
The number of funeral-related fundraisers increased by 22% on GoFundMe last year, figures shared with Sky News reveal.
Individual donations to these fundraisers increased by almost 400,000.
Many of these are trying to avoid their loved one being given a public health funeral, which is what happens if families are unwilling or unable to pay.
Local authorities are legally obliged to carry out funerals in this case, but they are given little guidance from the government on what this should entail - meaning each council will have its own policy on what is or isn't included.
In some cases, a service will not be offered and a person will be cremated or buried without the presence of family members.
Other times, the family may be allowed to attend but they might not be able to get involved in the service.
Generally, people will be cremated, unless they have asked not to be for religious or cultural reasons.
Those who are buried will often have a grave with no marker, or they may be placed in a communal grave.
"For someone that's lost a child or a husband or a wife or any loved one where you just haven't been able to provide closure, there's a sense of guilt that goes with it," Pastor Mick says.
As long as funeral costs remain eye-wateringly high, families across the country will be dealing with that guilt.
This week will see the Bank of England announce its latest interest rates decision - and experts believe borrowers will have to wait longer to see rates come down.
Policymakers appear set to hold out for stronger signs the cost-of-living crisis has abated, with economists widely expecting the Monetary Policy Committee (MPC) to keep rates at the current level of 5.25%.
Rates have been held at this level since August last year.
At the last meeting in March, just one member of the MPC voted for rates to be cut by 0.25 percentage points, but the remaining eight members voted for no change.
Philip Shaw, chief economist at Investec, said: "This broad direction illustrates that collectively the committee is moving gradually towards a rate cut.
"It seems unlikely though to be ready to bite the bullet just yet and the Bank rate looks set to remain on hold at 5.25% for the sixth consecutive meeting."
Andrew Goodwin, chief UK economist for Oxford Economics, said data on services inflation and private sector regular pay growth has "likely extinguished any remaining hopes of a move in May".
As for whether rates could be cut in June or August, he said it is likely to be a "close call".
Economists at HSBC are also expecting the first rate cut to come in June.
Interest rates are used as a tool to help bring down UK inflation.
The brewing giant has announced it will invest £39m in revamping 600 of its pubs across the UK - a move that will create more than 1,000 new jobs.
The investment plan will also see pubs in its retail arm, Star Pubs & Bars, revitalised to appeal to those working from home.
Sixty-two pubs will be reopened this year and 94 sites are set for full refurbishments.
The remaining pubs will receive varying upgrades.
Heineken said it wanted to "broaden each pub's use and appeal" in response to an increase in people working from home, giving customers more reason to visit throughout the day.
The refurbished pubs will have dividing screens to create separate areas for different types of customers.
Lawson Mountstevens, chief executive at Star Pubs & Bars, said: "Fundamentally, the changes in people's working habits means that in a lot of these suburban locations, you've got more people who are around those areas a lot more.
"It's not rocket science. Those people are looking for pubs of a certain standard."
Aldi remained the cheapest supermarket last month, new analysis shows.
The retailer has won the crown of cheapest supermarket every month so far this year, according to research by Which?.
An average basket of 67 popular groceries cost £112.90 - more than £30 cheaper than the most expensive supermarket, Waitrose.
A basket of comparable items in Waitrose would cost £144.13 on average.
Here is the breakdown for each supermarket...
- Aldi - £112.90
- Lidl - £115.23
- Asda - £126.98
- Tesco - £128.17
- Sainsbury's - £131.02
- Morrisons - £134.87
- Ocado - £136.86
- Waitrose - £144.13.
Food price inflation has slowed to 4.5%, its lowest level since February 2022.
Despite being the most expensive, Waitrose and Ocado were the only grocers to win new shoppers in the first three months of the year, according to research by Kantar.
Every Monday we get an expert to answer your money problems or consumer disputes. Find out how to submit yours at the bottom of this post. Today's question is...
"My daughter recently bought a flat and has since learnt there is an extra £600 a year management fee that was not declared by the vendor during the sales process. We have been told that the vendor was heavily involved in negotiating the management contract. Can we complain?" J Mills
Serena Amani, managing director at Monarch Solicitors , has this advice...
The general principle when buying a property is "buyer beware", which means the onus is on the buyer to perform their due diligence before contracting to purchase.
The buyer's conveyancing solicitor interrogates the contractual documentation and raises relevant enquiries to ensure the full facts and obligations are available to the buyer to make an informed decision.
In this situation, it appears the seller has failed to disclose the management fee - we assume relating to the services provided to the estate.
We can't give specific advice as we don't have access to the contractual documentation. However, we would suggest:
- To check if the obligation to pay a management fee is set out in the lease if it is a leasehold property, or the transfer deed if it is a freehold property. These documents should contain what services are provided and what the related charges are. The most common scenario is that of a leasehold flat. In this situation the services shall be set out under the service charges section. Generally, there is a provision that allows a management company to charge a management fee as a percentage of the overall service charge bill which is shared among all the leaseholders based on the size of their apartment.
- If the obligation to pay the management fee is in the contract and your conveyancer failed to notify you of this obligation, there is a potential negligence claim against the conveyancer which can be pursued through their complaints process and escalated to the legal ombudsman.
- In the rare instance that the management fee is not stipulated in the contract, then you may wish to contact the management company to obtain certified accounts for the services provided and ask them on what contractual basis they are charging a management fee. Management companies are obliged by statute to provide this information.
- If there is no contractual basis or the fees are unreasonable then you may consider bringing a claim before the property tribunal. The tribunal has the power to make a ruling on the reasonability of the management fees. It should be noted that it can be a long and arduous process and legal fees are not always recoverable even if successful.
- Where a seller has supplied misleading information about a property that materially influenced the decision to purchase the property, this could give rise to a claim for misrepresentation. Likewise, intentional concealment of this information during the sales process could constitute a breach of contract or misrepresentation.
For more specific advice, you may wish to contact a property lawyer experienced in the conveyancing process and service charge disputes.
This feature is not intended as financial advice - the aim is to give an overview of the things you should think about. Submit your dilemma or consumer dispute via - and please leave your contact details as we cannot follow up consumer disputes without them.
- The form above - make sure you leave a phone number or email address
- Email [email protected] with the subject line "Money blog"
- WhatsApp us here .
The long-awaited arrival of the sun in the last few days may have got you thinking ahead to the summer... which for many means holidays.
New analysis sent to the Money team has revealed the holiday resorts that Britons have been searching for over the last few months - although it's not a particularly sun-soaked destination that has come out on top.
Amsterdam is the most in-demand holiday destination for the UK, according to a study by Desert Safari Dubai Tours.
The company looked at Google search data over the past 12 months to find which holiday destinations were most popular in the UK, using terms such as "holidays to", "flights to" and "trips to".
Some 57,507 searches were carried out each month for trips to Amsterdam.
The second most in-demand was Dubai , with an average of 52,544 monthly searches.
Here is the rest of the list...
- New York - 51,169
- Paris - 43,326
- Tenerife - 43,305
- Barcelona - 41,664
- Dublin - 38,801
- Gran Canaria - 33,907
- Milan - 28,549
- Istanbul - 28,097
Meanwhile, data from holiday booking site Expedia suggests Britons are chasing the sun over the summer.
Its trending destination data shows a 50% increase in searches for mainland Greece - while its islands of Santorini and Corfu remain popular.
Interest is also surging in Mediterranean gem Malta (up 25%), seen as a more affordable destination.
Searches are also up 50% for Albania , which has seen a surge in interest due to social media.
The short-haul hotspot of Tunis has seen searches rocket by 130%.
We're back for another week of consumer news, personal finance tips and all the latest on the economy.
This is how the week in the Money blog is shaping up...
Today : Every week we ask industry experts to answer your Money Problems . Today, a Money blog reader believes they may have been misled when buying their flat - but what can they do?
Tuesday : This week's Basically... explains everything you need to know about the Bank of England, ahead of Thursday's base rate decision.
Wednesday : We speak to the chef at Tom Kerridge's two-starred pub The Hand And Flowers in Buckinghamshire for his Cheap Eats.
Thursday : It's decision day for the Bank of England, and while interest rates are expected to be held at 5.25%, we may learn more about when a cut will come. Savings Champion founder Anna Bowes will be back with her weekly insight into the savings market.
Friday : We will be getting the latest GDP figures on this day - which could signal the UK is no longer in recession. Plus, we'll have everything you need to know about the mortgage market this week with the guys from Moneyfacts.
Running every weekday, Money features a morning markets round-up from the Sky News business team and regular updates and analysis from our business, City and economic correspondents, editors and presenters - Ed Conway , Mark Kleinman , Ian King , Paul Kelso and Adele Robinson .
You'll also be able to stream Business Live with Ian King weekdays at 11.30am and 4.30pm.
Bookmark news.sky.com/money and check back from 8am, and through the day, each weekday.
The Money team is Emily Mee, Bhvishya Patel, Jess Sharp, Katie Williams, Brad Young and Ollie Cooper, with sub-editing by Isobel Souster. The blog is edited by Jimmy Rice.
You filled out the job application, got the call (they're interested, phew!), but now... it's interview day.
If the thought of selling yourself to a stranger brings you out in a cold sweat, you're not alone - but you can help yourself by not making the following common mistakes...
1. Not dressing app ropriately
Paul Webley, managing director of Blaze Media Digital Marketing Agency in Merseyside, says: "If you are coming for an interview in a marketing agency, dress smart. No need to be in a suit. It's cute if you are but just dress how you would expect to dress in the job and, if in doubt, err on the side of being slightly smarter.
"With us, there are loads of photos of the team in the office on the website and socials (which you should have looked at) so there is no excuse."
Tell us your interview mistakes/stories/tips in the comments box
2. Handshake mishaps
Paul's second interview mistake is: "This one is a real pet hate and probably doesn't matter as much in the current world but... learn how to shake a person's hand. You have to do this within every job from time to time.
"There is nothing more off-putting than a limp shake. Having a firm, polite handshake is a basic human skill in business and beyond."
3. Complaining
This is another one from Paul: "We had someone a few months ago tell us that they didn't think they should have to come into the office for an interview. This was for an office-based role. If they don't think it's worth coming in then the job is not going to be for them."
4. Not checking your tech
Tas Ravenscroft, senior consultant at recruitment firm Cherry Pick People , says: "Overlooking details like the interview location or the platform being used (such as Teams), and not testing your tech beforehand, can disrupt the interview process. This is especially crucial as most first interviews are now conducted via video conferencing."
5. Bad mouthing previous employers
Tas says: "We see that candidates sometimes feel too comfortable on interview and decide to talk about their past experiences (if aggrieved) negatively, which is a big NO. Instead, my advice is to focus on the lessons learned and how you've grown from challenges in your career."
6. Not asking questions - or asking about benefits or sick pay policy
Tas says: "There are no right or wrong answers to this, but asking questions at the end of the interview is a big YES. It shows you're interested, engaged and would like the opportunity to either progress or land the role.
"I'd say in your first interview, ask about company culture, day to day tasks, expectations of this role, who's the best performer and why?
"Questions I'd stay away from are benefit-related questions, or I recently had someone ask what the sick pay policy was like in the first interview… Safe to say they didn't get invited back. If you work with a recruiter, you will have salary and benefits info before, so no need to ask on interview."
7. Not showing enthusiasm
For Mike Carlucci, managing director of Reading-based Italian-food importer Tenuta Marmorelle , this is a big one: "A lot of people at the moment are applying for everything and anything. They apply for hundreds of jobs.
"The result is that you get applicants who are not enthusiastic or passionate about the role or sector as they see it just as a job. There are few people looking for actual careers at the moment. In our industry, the food industry, you need to have passion and enthusiasm."
8. Talking too much
Andrew MacAskill, founder of Executive Career Jump , says: "Sometimes this is down to nerves, other times it is down to overthinking and often it is due to the questions being too broad, which leads to them saying lots and hoping the right answer is in there somewhere."
Ian Nicholas, global managing director at Reed , says a common slip-up people make is to carry on talking after giving their answer.
"Some interviewers may purposely leave a pause just to see how the interviewee will react under the pressure - so be confident in what you've said and know when you've finished."
9. Under-preparation
Habiba Khatoon, director of Robert Walters UK , says: "This means they haven't researched the company, are unaware of the key aspects of the role they are interviewing for and can't make connections between their CV and experience and the role.
"Most interviewers can easily catch on when a candidate has turned up unprepared and when they do, they can lose interest in that candidate quite quickly."
Italian food importer Mike agrees: "It is so important to spend five minutes to go on to the website, see what the company does, how they started and any general information you can get. This really makes someone stand out from the 100s of applicants."
10. Being late - or too early
James Rowe, managing director of the Recruitment Experts , says: "I would suggest arriving 20 minutes early to give you time to prepare, but don't walk through the door too soon! Turning up five to 10 minutes prior to your interview start time shows you're punctual but won't rush the hiring manager… they need breaks too!"
By Brad Young , Money team
Almost half of Britons (45%) subscribe to two or more streaming services, according to comparison website Finder, but box office figures show the theatre-going experience is making a comeback.
The pendulum is swinging back from streaming-first to theatre-first releases, and streaming platforms like Amazon and Apple are making moves on to the big screen with the likes of Saltburn and American Fiction, or Killers of the Flower Moon and Napoleon.
That means movie-lovers are facing a conundrum, according to a senior media analyst: should they prioritise spending cash on trips to the cinema or on streaming if they want to see the biggest and best movies?
"People are making decisions on 'what am I going to allocate to the movie theatre experience, what am I going to allocate to streaming?'" Paul Dergarabedian, of Comscore, told the Money blog.
Cinema's revival is real, according to Philip Clapp, chief executive of the UK Cinema Association.
"Certainly the major US studios see the theatrical experience, the big screen experience, as where they want their major films to be and then benefitting from the promotional buzz that comes from that," Mr Clapp said.
Disney chief executive Bob Iger said last year that theatrically released films were "great sub drivers".
"We benefit greatly from the power of our great films, they drive so much engagement and so much interest in our platforms," he said, pointing to Moana, Marvel, Star Wars and Avatar.
Mr Clapp added this year was a "key stepping stone" to an offering similar to before the pandemic, but cinema wouldn't be back to full strength until next year.
In the pandemic, studios experimented with straight-to-streaming releases, which continued even after restrictions fell away.
Mr Dergarabedian said: "When the pandemic hit it was a real stress test on the industry because a lot of people thought theatrical was dying on the vine and that it would be going away at some point in the near future - and then the pandemic accelerated that demise in the minds of some."
But audiences have voted with their feet and instructed studios they want more variety: international films, stadium concert films, videogame adaptations, prestige films and horrors.
Smile, a Paramount horror movie on a $17m budget that could have been straight-to-streaming, had a "great result" at the box office, said Mr Dergarabedian, as did Five Nights at Freddy's.
Low and mid-budget movies have been the slowest to recover but are returning to the big screen, making the theatre offering more diverse this year, Mr Clapp added.
Mr Dergarabedian said Universal's "diverse portfolio" was the one to beat: it spent the last year putting out everything from action films like Fast X, prestige movies like Oppenheimer, animations like Migration and some spookier offerings too.
Going theatrical still comes with a risk, the analyst said. A flop on the big screen leaves studios with a big hit to their bottom line, having spent large amounts on distribution and marketing.
But films "tend to have more value" once they arrive on a streaming platform if they were released in cinemas first, including lower budget movies.
Each week, Money blog readers share their thoughts on the subjects we've been covering, and over the past seven days your correspondence has been dominated by these topics...
Brexit rule changes
- Our feature on manifesting
- The prospect of disability payments becoming vouchers
Britons could face higher food prices, and even empty supermarket shelves, as new post-Brexit border fees were introduced this week, industry figures warned.
These comments - while perhaps not representative of the whole country - are definitely reflective of the majority view in our inbox...
It's almost like Brexit was a terrible idea… To think our politicians would do anything but make things worse was beyond naive. People let their prejudice override common sense that most politicians look out for themselves and not the country's best interests… Joe
Others suggested the government should be turning its eyes to the issue rather than elsewhere...
Food prices rise even though they told us they would fall and yet the priority is sending asylum seekers to Rwanda. Isn't it about time the UK started to listen to people's problems rather than a very loud minority? Lee
Several people suggested the solution was growing all our own food - which is often talked about, but producers and importers point out the UK climate makes it less achievable to mass produce certain foods at a low cost than in southern Europe.
Disability vouchers?
Reports this week suggested disabled people could receive vouchers instead of monthly payments under proposed government changes to Personal Independence Payment (PIP).
The story resulted in a backlash among our commenters...
Absolutely barking mad. Disabilities aren't an option. Can't be fixed with words. And can happen to anyone at anytime. Time to get a grip. Rob
Others suggested it was a symptom of a wider failure within the system...
I don't know how the government can take away vital PIP money and say they can replace it with better mental health support. My daughter is waiting for a PIP assessment and also an assessment for ADHD - the latter's wait time is currently four years. Matmac33
Can you 'manifest' financial success?
Moving to our manifesting feature, which prompted a lot of cynicism. If you haven't read it yet, you can do so here ...
Some of our readers are believers...
I manifest things in my life. Be it money, people or events I've had dreams about, there's more magic in the universe than most people know of. Steve
I believe in manifestation in terms of positive thinking. You'll never get anywhere if you're always assuming the worst. But you do have to put the leg work in for what you want, it won't fall in to your lap. Jim Carrey didn't get that £10m acting job sitting under a tree! Caroline D
Others, well, not so much...
Why are you giving space to this specious guff manifestation? Does it work for the poverty-stricken, starving millions without basic infrastructure and education, or those suffering in warzones across the world? I wonder what they want "manifesting" in their lives? FM1
"Manifesting", what a load of rubbish! I can't believe this is one of the top stories on Sky News. David
And finally, in our weekly round-up of your comments...
This comment section is a COMPLETE WASTE OF TIME. Sky NEVER publishes its readers' views. John Hammond
Be the first to get Breaking News
Install the Sky News app for free

COMMENTS
Open Travel Data (OPTD) provides a collection of transport, travel and leisure related data. The project makes extensive use of already existing data sources such as Geonames and Wikipedia , and adds some glue around those (e.g. links). All data sets are as carefully maintained as possible, and kept up-to-date by the OPTD team, which we would ...
Open Travel Data (OPTD) provides a collection of transport, travel and leisure related data. The project makes extensive use of already existing data sources such as Geonames and Wikipedia, and adds some glue around those (e.g. links).. All data sets are as carefully maintained as possible, and kept up-to-date by the OPTD team, which we would be glad to welcome you on!
Stravl-Data is the world's largest, open-sourced data set of travel preferences. Through a user-facing website, Stravl gathered 80,301 travelers' vacation preferences. Users were asked to fill out a brief form on their ideal vacation preferences (such as expected experiences, scenery, and activity level) and logistical constraints (such as ...
About OpenTravel. The OpenTravel Alliance provides a community where companies in the electronic distribution supply chain work together to create an accepted structure for electronic messages, enabling suppliers and distributors to speak the same interoperability language, trading partner to trading partner. Learn More.
Measurement(s) travel-related behavior • travel-related attitude Technology Type(s) Survey Factor Type(s) temporal interval Sample Characteristic - Organism Homo sapiens Sample Characteristic ...
International Tourism and COVID-19. Export revenues from international tourism dropped 62% in 2020 and 59% in 2021, versus 2019 (real terms) and then rebounded in 2022, remaining 34% below pre-pandemic levels. The total loss in export revenues from tourism amounts to USD 2.6 trillion for that three-year period. Go to Dashboard.
Collection of open data related to (at least) travel, transport, tourism. Awk 230 97 14 (2 issues need help) 0 Updated 3 days ago. python-opentraveldata Public. Python wrapper around OpenTravelData (OPTD) Python 2 1 1 2 Updated on Apr 4. quality-assurance Public.
And there is Open Data for all kind of travel purposes, regardless of whether you are going to visit a city, explore nature or relax on the beaches. For instance, 695 datasets are found for "camping" on the European Data Portal. An example is a dataset originating from Saarland, one of the sixteen Bundesländer of Germany.
Tourism has massively increased in recent decades. Aviation has opened up travel from domestic to international. Before the COVID-19 pandemic, the number of international visits had more than doubled since 2000. Tourism can be important for both the travelers and the people in the countries they visit. For visitors, traveling can increase their ...
Open Data plays a key part in promoting the tourism sector. The company outdooractive manages many tourist data with the open central database solution. These include events, current news, region and place descriptions, tours and activity trail networks, accommodation reviews, excursion destinations and sights, and stories, pictures or videos.
Built by the Travel Industry, For the Travel Industry. Since 2001, OpenTravel has built, promoted and evolved the data messaging standard for the travel industry. The combined efforts of all of our stakeholders over the years have resulted in a unifying specification that has been implemented by hundreds of travel companies - representing ...
Quality Assurance (QA) for Open Travel Data (OPTD)
About data.world; Terms & Privacy © 2024; data.world, inc ... Skip to main content
Usage. Launch a Python interpreter: $ python. >>>. Import the opentraveldata library: >>> import opentraveldata. Specify a variable, say myOPTD, as a handle on the OPTD library. With the default local directory for the data files, that is /tmp/opentraveldata. >>> myOPTD = opentraveldata.
UN Tourism systematically collects tourism statistics from countries and territories around the world in an extensive database that provides the most comprehensive repository of statistical information available on the tourism sector. This database consists mainly of more than 145 tourism indicators that are updated regularly. You can explore the data available through the UNWTO database below:
In response the OpenTravel Alliance (OTA) and the OpenAPI Initiative (OAI) will work together to focus on API conventions and standards, not just messages. Within OAI, there is now a special interest group to focus on travel issues (#sig-travel). The travel SIG will be the conduit for the needs of the travel industry that pertain to the OpenAPI ...
There are 60 tourism datasets available on data.world. Find open data about tourism contributed by thousands of users and organizations across the world. ... (TIC) are located at several travel plazas and interchanges along the Thruway ... Dataset with 18 projects 1 file 1 table. Tagged. information tourism questions attractions transportation ...
Download Open Travel Data for free. Framework (scripts, configuration, code) to build free and public services around travel and leisure data. That project makes an extensive use of already existing data sources such as Geonames and dbPedia, and adds some glue around those (eg, links).
If the issue persists, it's likely a problem on our side. Unexpected token < in JSON at position 4. keyboard_arrow_up. content_copy. SyntaxError: Unexpected token < in JSON at position 4. Refresh. This dataset provides detailed information on various trips.
The OTDS association. The "Verein zur Förderung eines offenen touristischen Datenstandards e.V." (Association to promote an Open Travel Data Standard, OTDS e.V. in Berlin, Germany) specifies and develops the data format OTDS for the travel industry. OTDS is based on open, nondiscriminatory, and standardized technologies.
1. Documentation. OpenTravel provides the Specifications for voluntary use by individuals, partnerships, companies, corporations, organizations, and other entities at their own risk.; The Specifications and any OpenTravel supplied supporting information, data, or software in whatever medium in connection with the Specifications are referred to ...
TECHNOLOGY PARTNERS. In partnership with leading technology developers we create powerful solutions you can count on, with the flexibility to scale and grow with your needs. OAG is the world's leading provider of digital flight information, intelligence and analytics for airports, airlines and travel tech companies.
Calls, including over Wi-Fi, are $.25/min. (no charge for Wi-Fi calls to US, Mexico, and Canada). Go5G plans: Up to 10GB high-speed data in select Central European countries; otherwise, standard speeds approximately 256 Kbps. Go5G Next and Go5G Plus: Up to 15GB high-speed data in 215+ countries and destinations, then unlimited at up to 256 Kbps.
The chaos locks a lot of travel content out of the market as it is too expensive to connect. There is a large impact on the extension of AI/ML solutions for travel retail, because of poor data quality. This is directly due to the lack of a common understanding of data syntax. This can only be resolved as a community.
Free and open company data on Texas (US) company Castillo Travel Agency LLC (company number 0805509395), 3225 WOODLAND PARK DR APT 512, HOUSTON, TX, 77082-7621 ... Castillo Travel Agency LLC (trading name, 2024-04-17 - ) Agent Name Xiomara Perez Ruiz Agent Address 3225 Woodland Park Dr apt512, Houston, TX, 77082, USA
The company looked at Google search data over the past 12 months to find which holiday destinations were most popular in the UK, using terms such as "holidays to", "flights to" and "trips to".